Raw "Win Rate" is a vanity metric. A 5-0 record on lucky parlays doesn't prove an edge; it just shows variance. We rely on Bayesian Shrinkage. It's an industry standard technique used across sports analytics, insurance, and quantitative finance to separate actual signal from random noise.
1. The Problem: Small Samples Lie
A capper going 3-2 at +200 odds boasts a fast 40% ROI. A naive grading system would hand them an instant A+. But anyone who has flipped a coin knows that 5 trials tell you almost nothing. On the flip side, someone who grinds out a +6% ROI over 200 picks has shown a real, sustainable edge.
Our algorithm answers a core question: "Given this capper's track record and the amount of data we have, what is the best estimate of their actual skill?"
2. The Bayesian Prior (The Market Baseline)
Before we even look at a single pick, we start with a prior belief. The average bettor loses money over time. The standard sportsbook vig on a -110/-110 line sits around 4.5%. Because of this, the expected ROI for someone betting at random is:
This acts as our prior ROI. Every capper starts right here and has to earn their way up using cold, hard data. We assume a capper with zero picks has a -5% ROI, because that is the baseline for an average bettor.
3. The Shrinkage Formula
The core of our algorithm comes down to one clear equation. It blends the capper's observed ROI with our prior expectation, and we weigh everything by the sample size:
Where:
- $\hat{R}$ = Adjusted ROI (the grade input)
- $R_{obs}$ = The capper's observed (raw) ROI
- $n$ = Number of graded picks
- $k = 30$ = The shrinkage constant (our "half-life of trust")
- $\mu_0 = -5\%$ = The prior (market baseline)
What does $k = 30$ mean?
Once a capper hits 30 picks, their weight reaches a clean 50%. Their adjusted ROI becomes the midpoint between their actual results and the baseline prior. You can think of it like this: "I need to see 30 picks before giving you the benefit of the doubt half the time."
- At 5 picks: Trust weight = 14%. The prior dominates the calculation.
- At 30 picks: Trust weight = 50%. We have equal belief in the capper and the baseline.
- At 100 picks: Trust weight = 77%. The capper's data speaks much louder.
- At 300 picks: Trust weight = 91%. We have total conviction in their edge.
| Picks (n) | Observed ROI | Trust Weight | Adjusted ROI | Grade |
|---|---|---|---|---|
| 5 | +40% | 14% | +1.4% | B |
| 30 | +40% | 50% | +17.5% | A+ |
| 100 | +40% | 77% | +29.6% | A+ |
| 5 | -20% | 14% | -7.1% | F |
| 300 | +10% | 91% | +8.6% | A+ |
4. Why Bayesian Shrinkage is Better
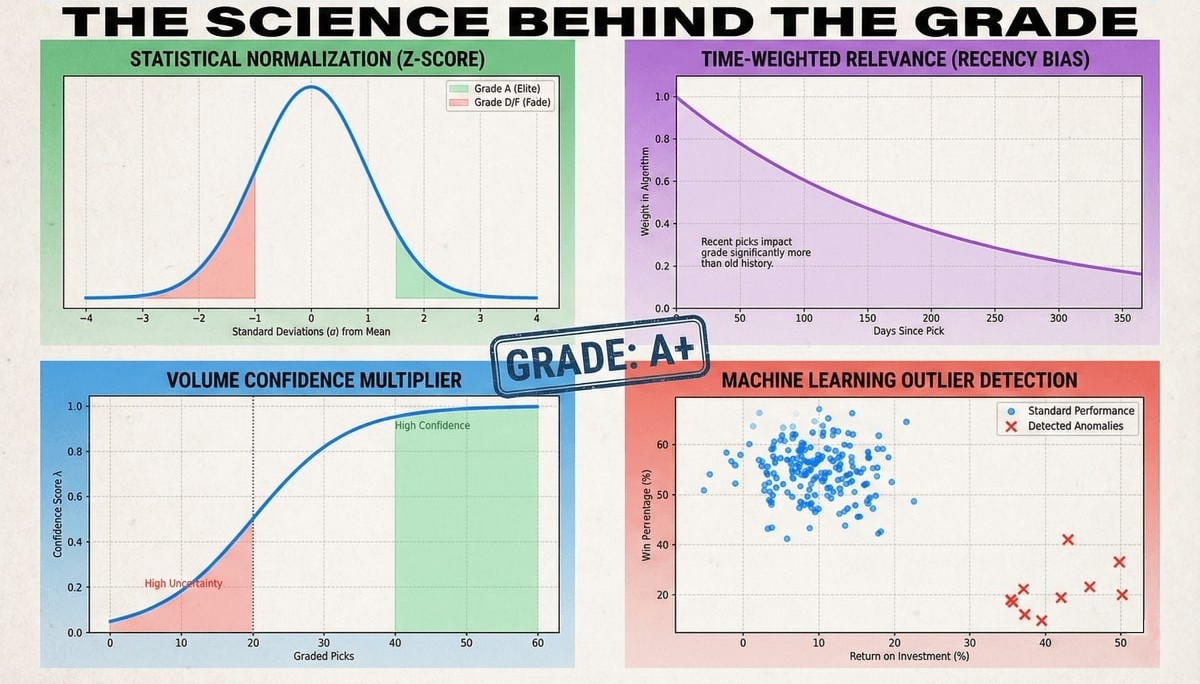
Instead of using basic confidence multipliers or z-score systems, Bayesian shrinkage offers three major advantages:
- Symmetric: Both small-sample winners and losers regress toward the prior baseline. A brutal 5-pick losing streak doesn't doom a capper to an "F", just as a lucky 5-pick hot streak won't earn them an "A+".
- Absolute: Our grades reflect actual betting skill instead of a basic population ranking. If every capper on the platform is losing money, we don't hand out A grades to the "least bad" performers. Earning an A requires a genuine, proven edge.
- Intuitive: The single parameter $k$ answers one straightforward question: "How many picks do we need to see before we believe you?"
5. Anomaly Protection
Before we calculate any final grade, we apply outlier clamping to protect the system against manipulation. We analyze each capper's picks for a few specific red flags:
- Unit Size Outliers: Bet sizes falling outside the standard IQR range ($Q_1 - 1.5 \times IQR$, $Q_3 + 1.5 \times IQR$) get clamped to the nearest boundary. This stops a user from max-betting one single game just to distort their overall results.
- Odds Range Limits: We replace odds outside the $-500$ to $+350$ range ($1.20$ to $4.50$ in Decimal format) with a standard $-110$ flat rate. This neutralizes the impact of massive lottery-ticket bets placed on extreme odds.
The final grade you see on our platform always uses this "Protected" variant, meaning the ROI calculation happens after we clean up those anomalies.
6. Case Study: The Turtle vs. The Hare
So why does raw ROI fail as a metric? Let's look at two real-world archetypes. The Hare makes reckless bets on huge, chaotic parlays. The Turtle grinds out tiny edges game after game. Our algorithm spots the difference right away.
"The Hare"
ALGORITHM GRADE
Flashy ROI, but at only 10 picks the prior still pulls it down.
"The Turtle"
ALGORITHM GRADE
Rewarded for proven, sustained edge over 255 picks.
Take a closer look at the numbers. The Hare boasts a much flashier raw ROI (+45% compared to +6.2%), but the Turtle's adjusted ROI trails close behind. This happens because 255 picks carry far more weight than just 10. The Turtle built a reliable foundation, whereas the Hare's shiny grade could vanish after just one bad week.
7. Grade Scale
The final Adjusted ROI ($\hat{R}$) maps straight to a letter grade. Here is how it breaks down:
| Grade | Adjusted ROI | Meaning |
|---|---|---|
| A+ | ≥ 8% | Elite edge, sustained over significant volume |
| A | ≥ 5% | Strong, proven edge |
| B+ | ≥ 3% | Above-average performer |
| B | ≥ 1% | Slight edge over the market |
| C+ | ≥ -1% | Break-even territory |
| C | ≥ -3% | Slightly below market average |
| D | ≥ -5% | Losing to the standard vig |
| F | < -5% | Confidently below market |
Any cappers with fewer than 5 graded picks receive no grade at all (displayed as "-"). We do this to stop pure noise from generating fake grades.