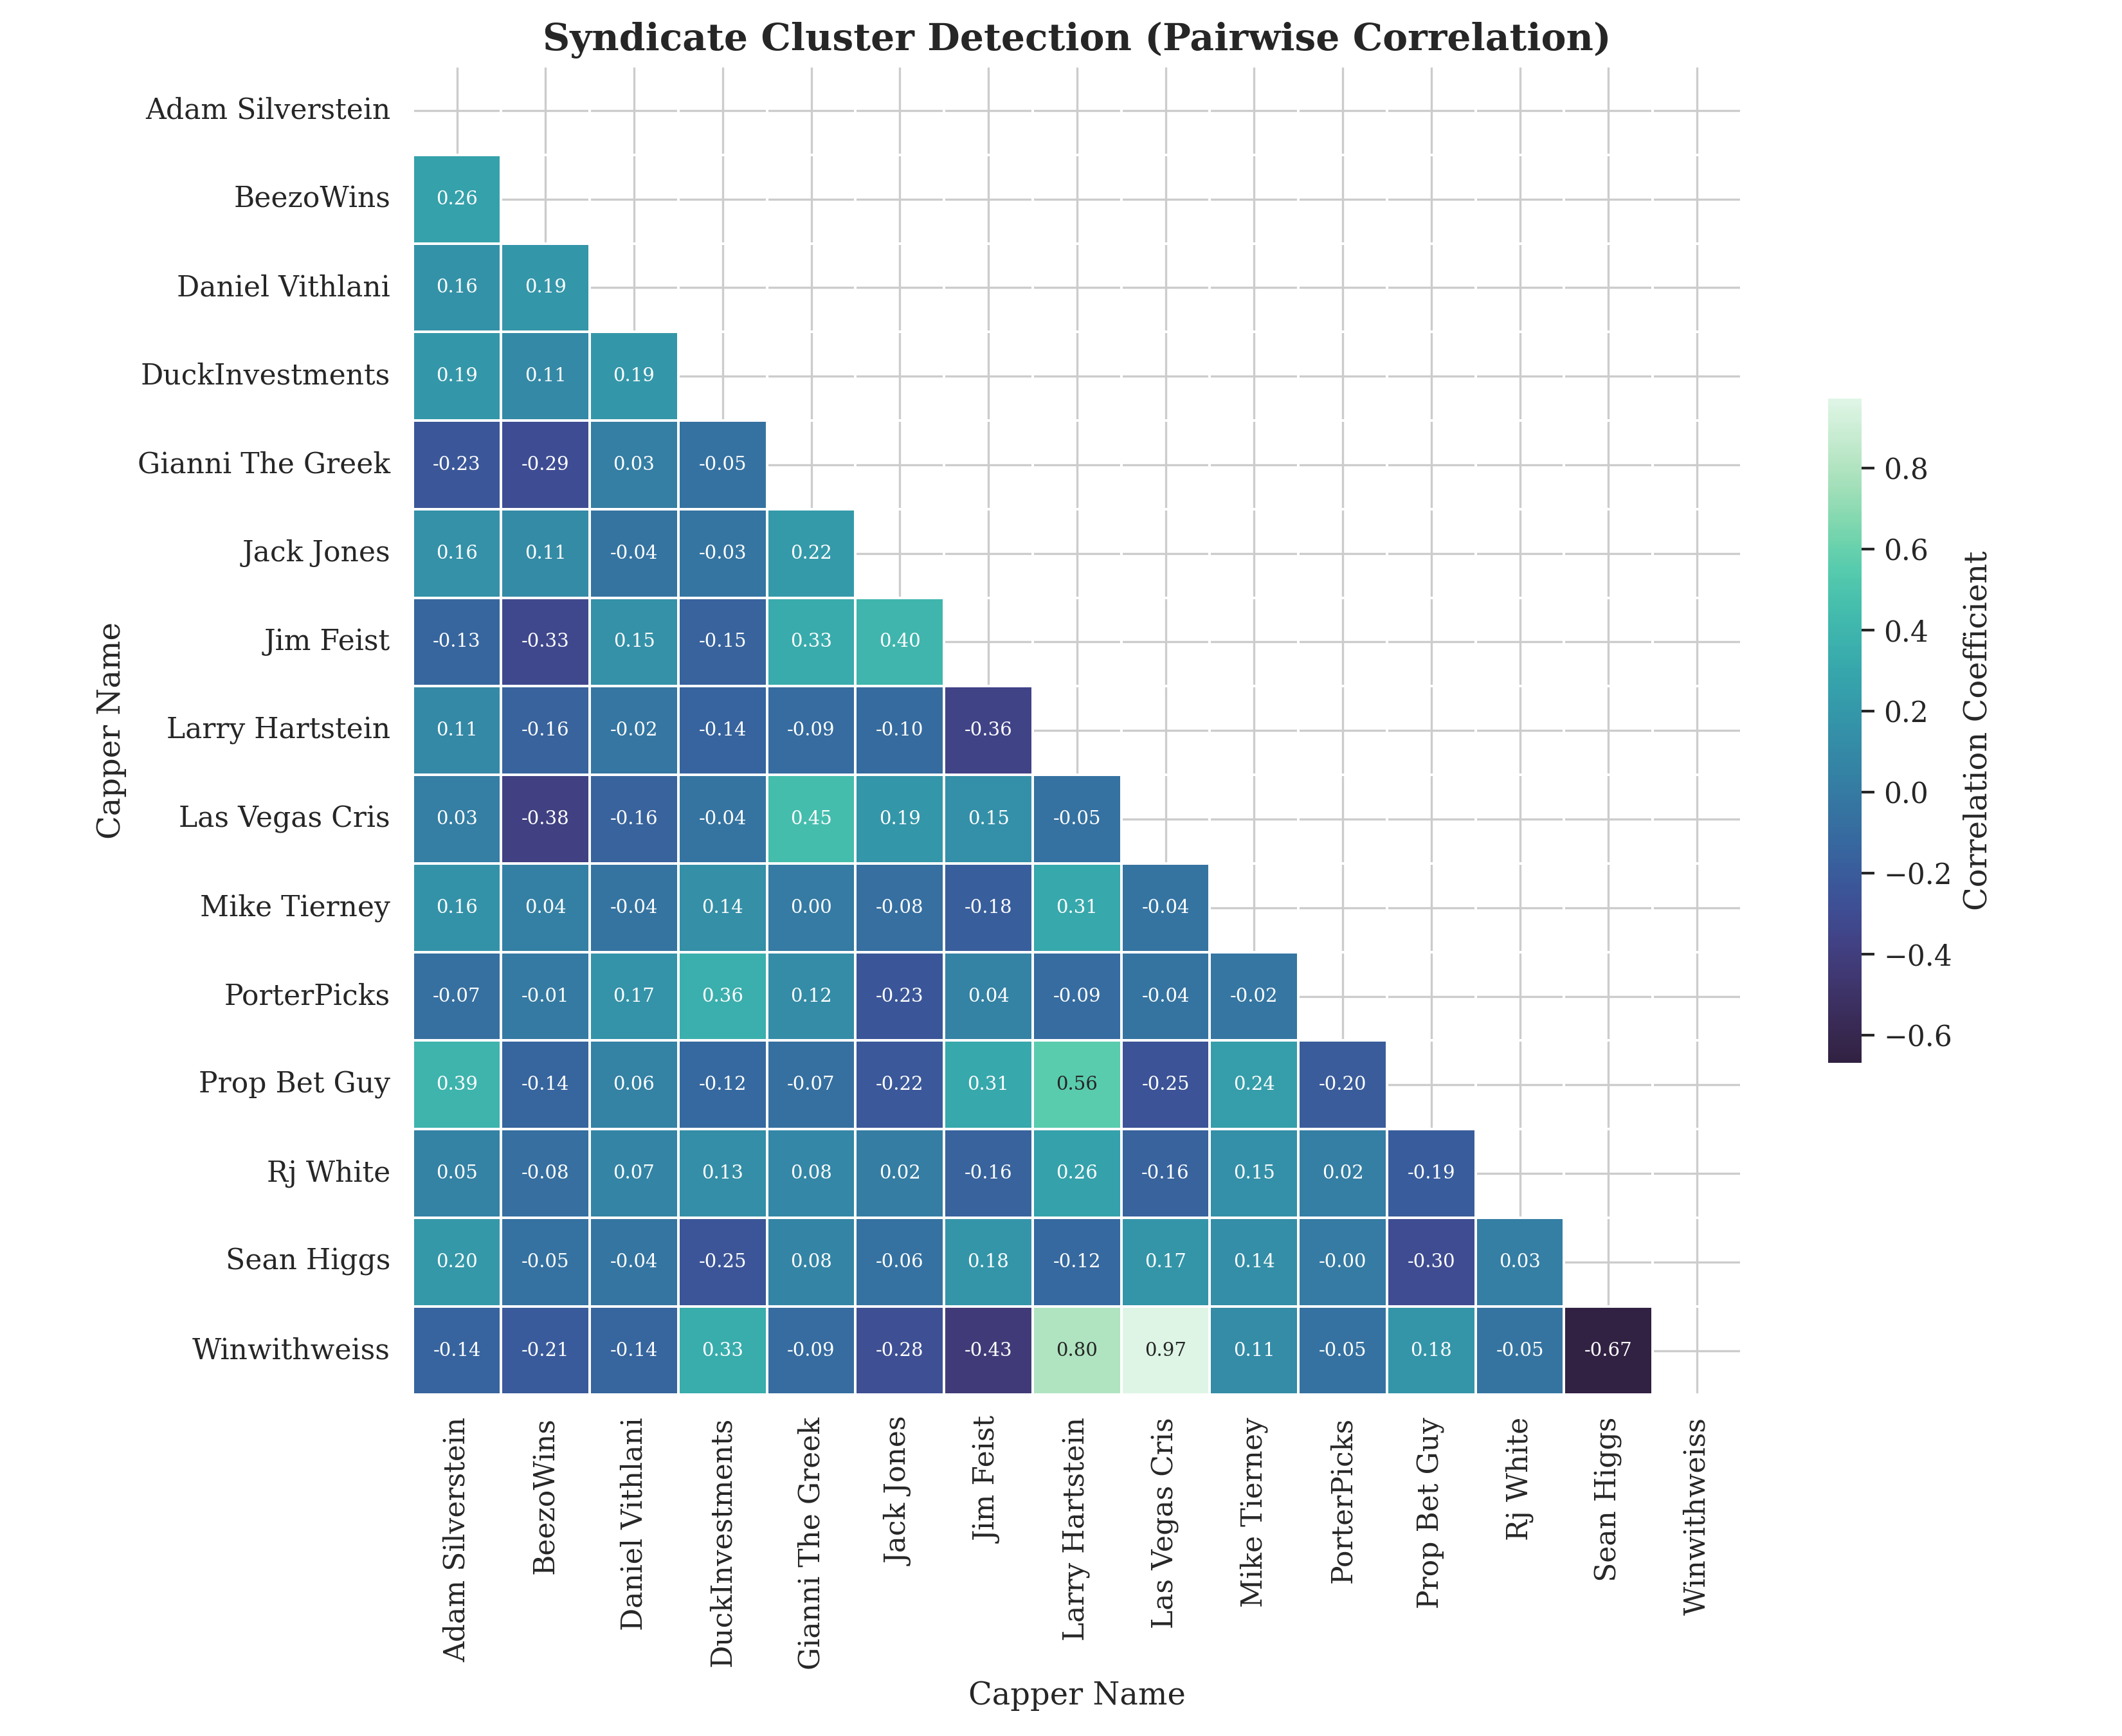
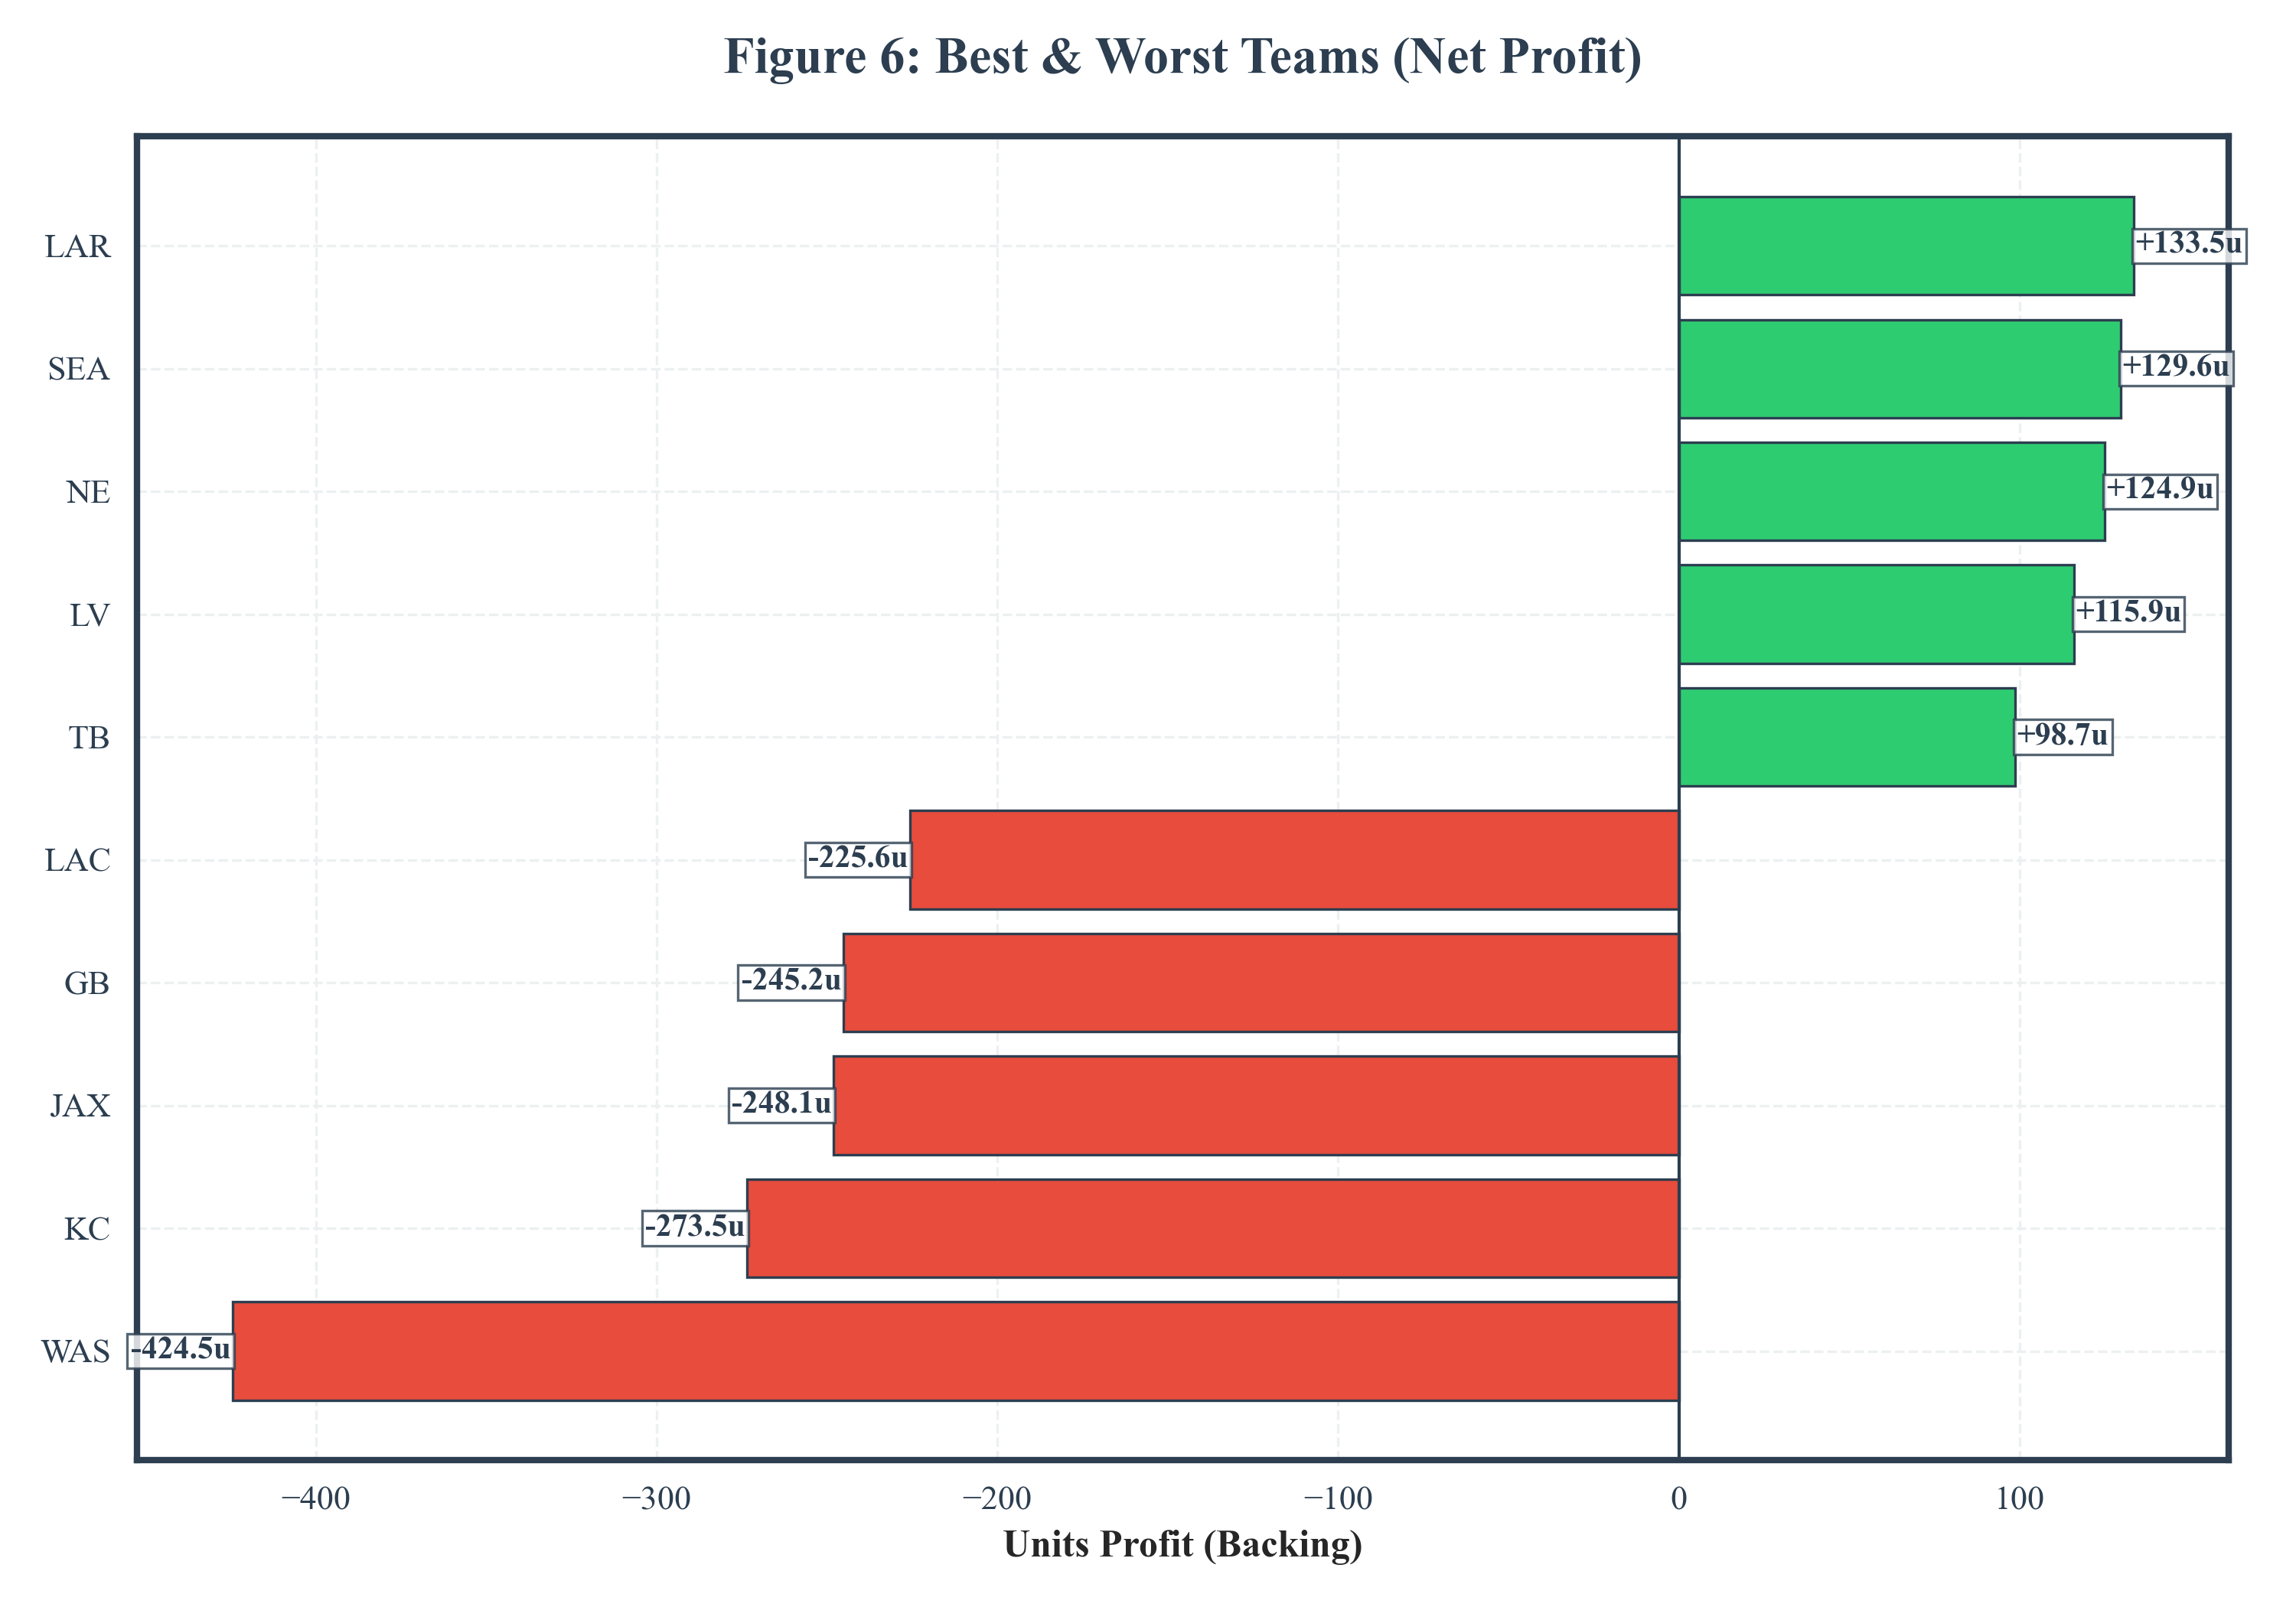
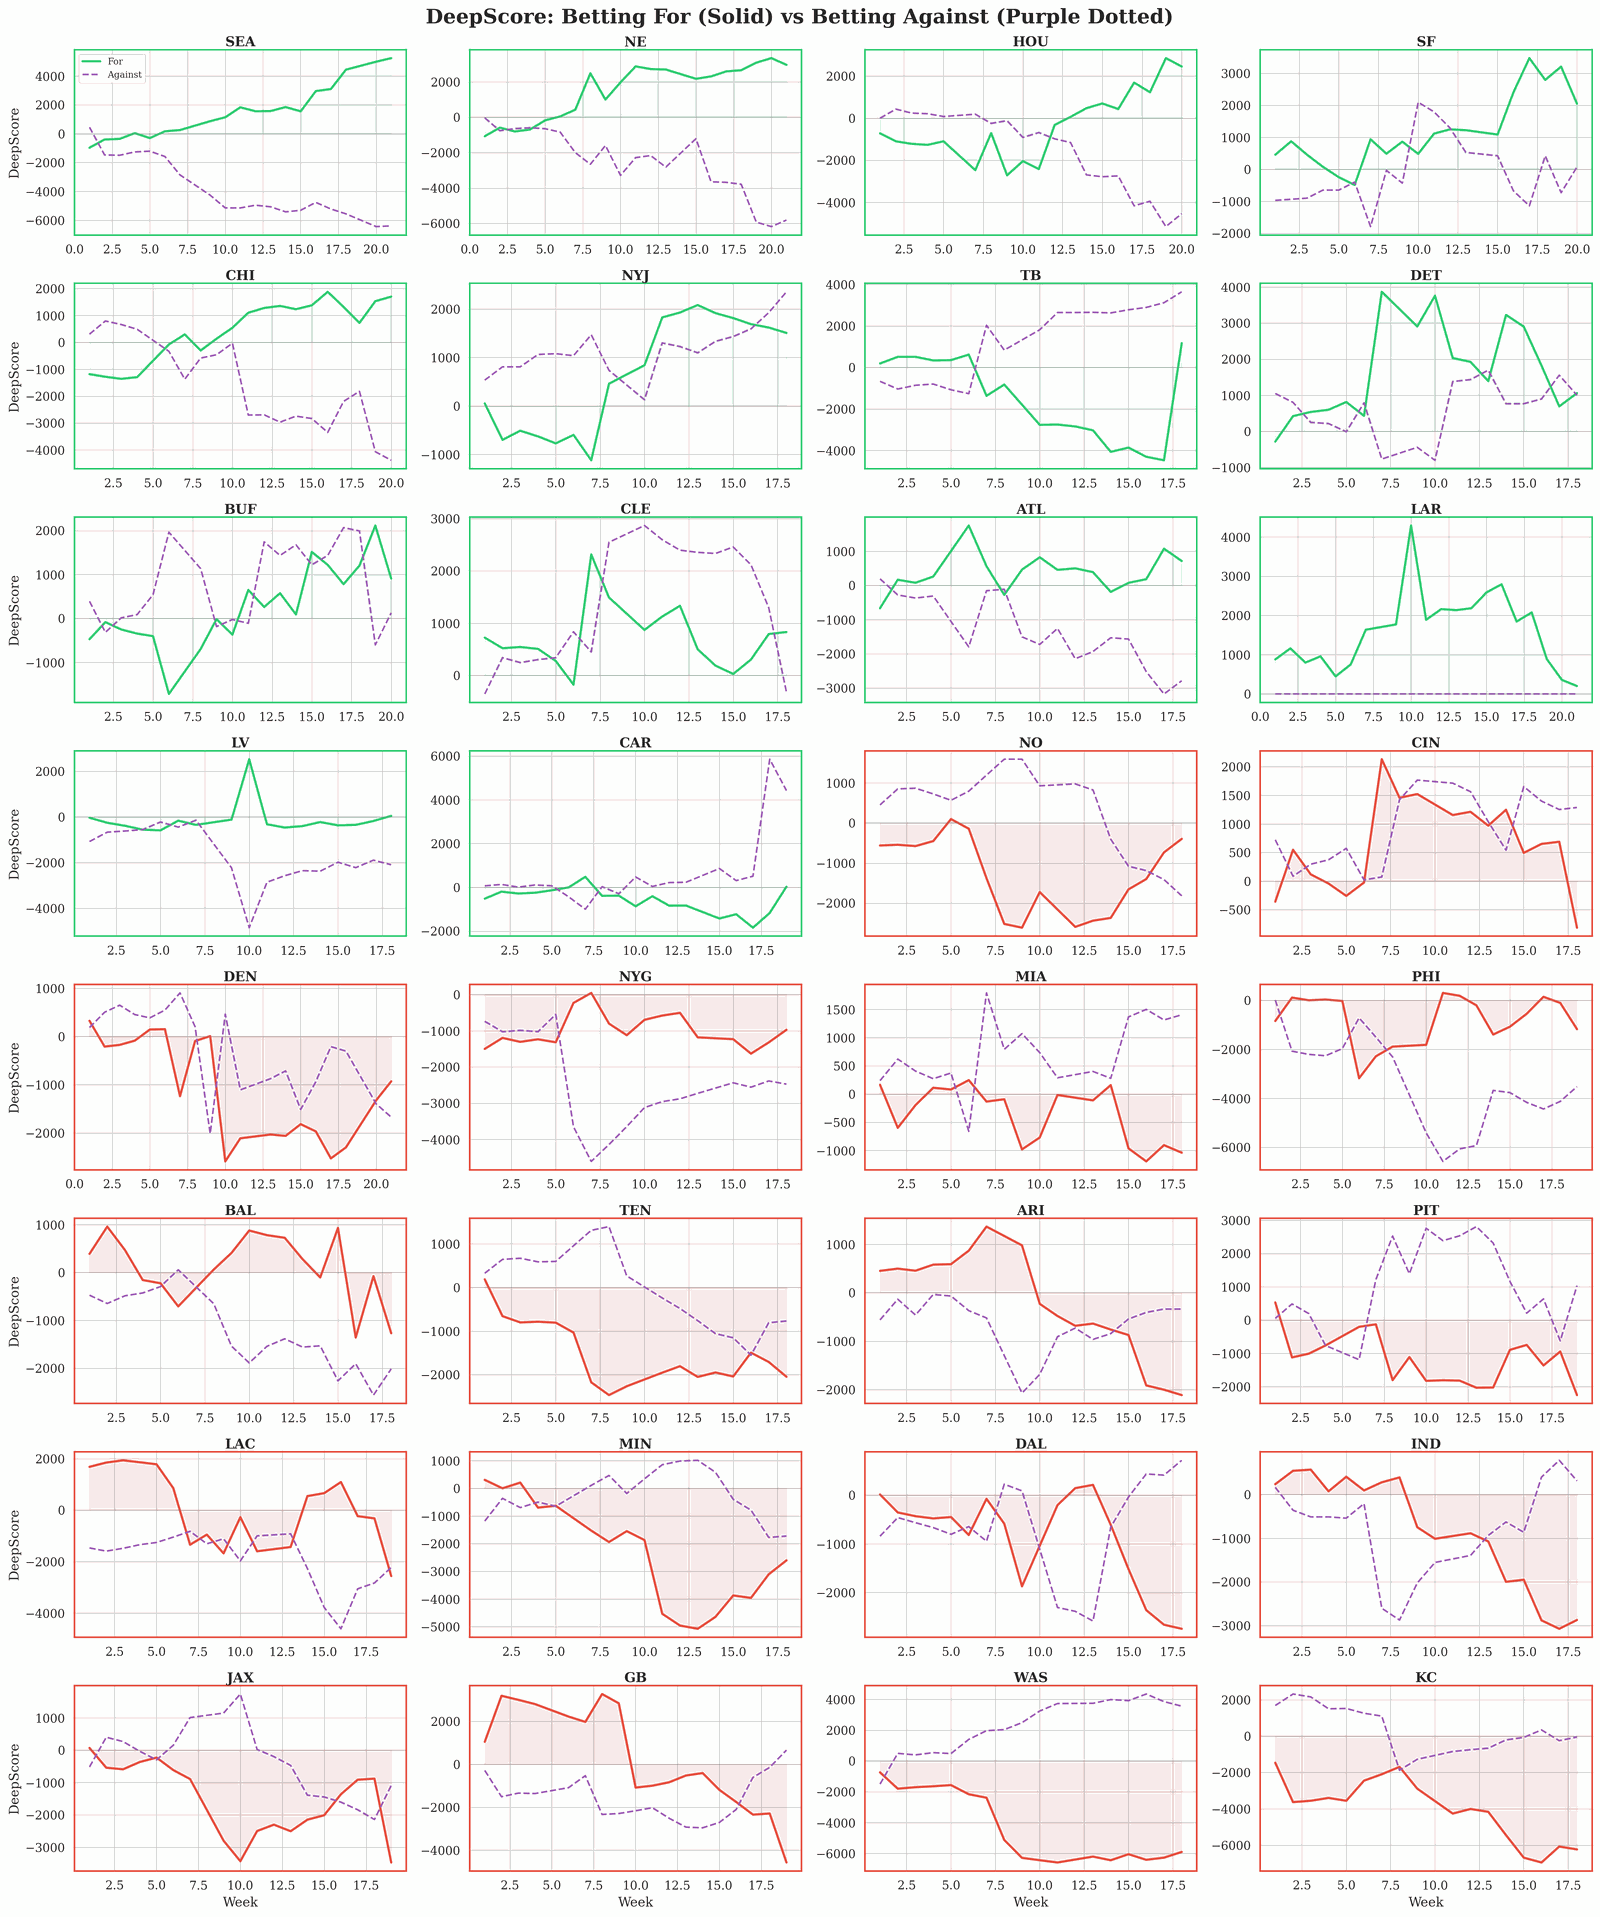
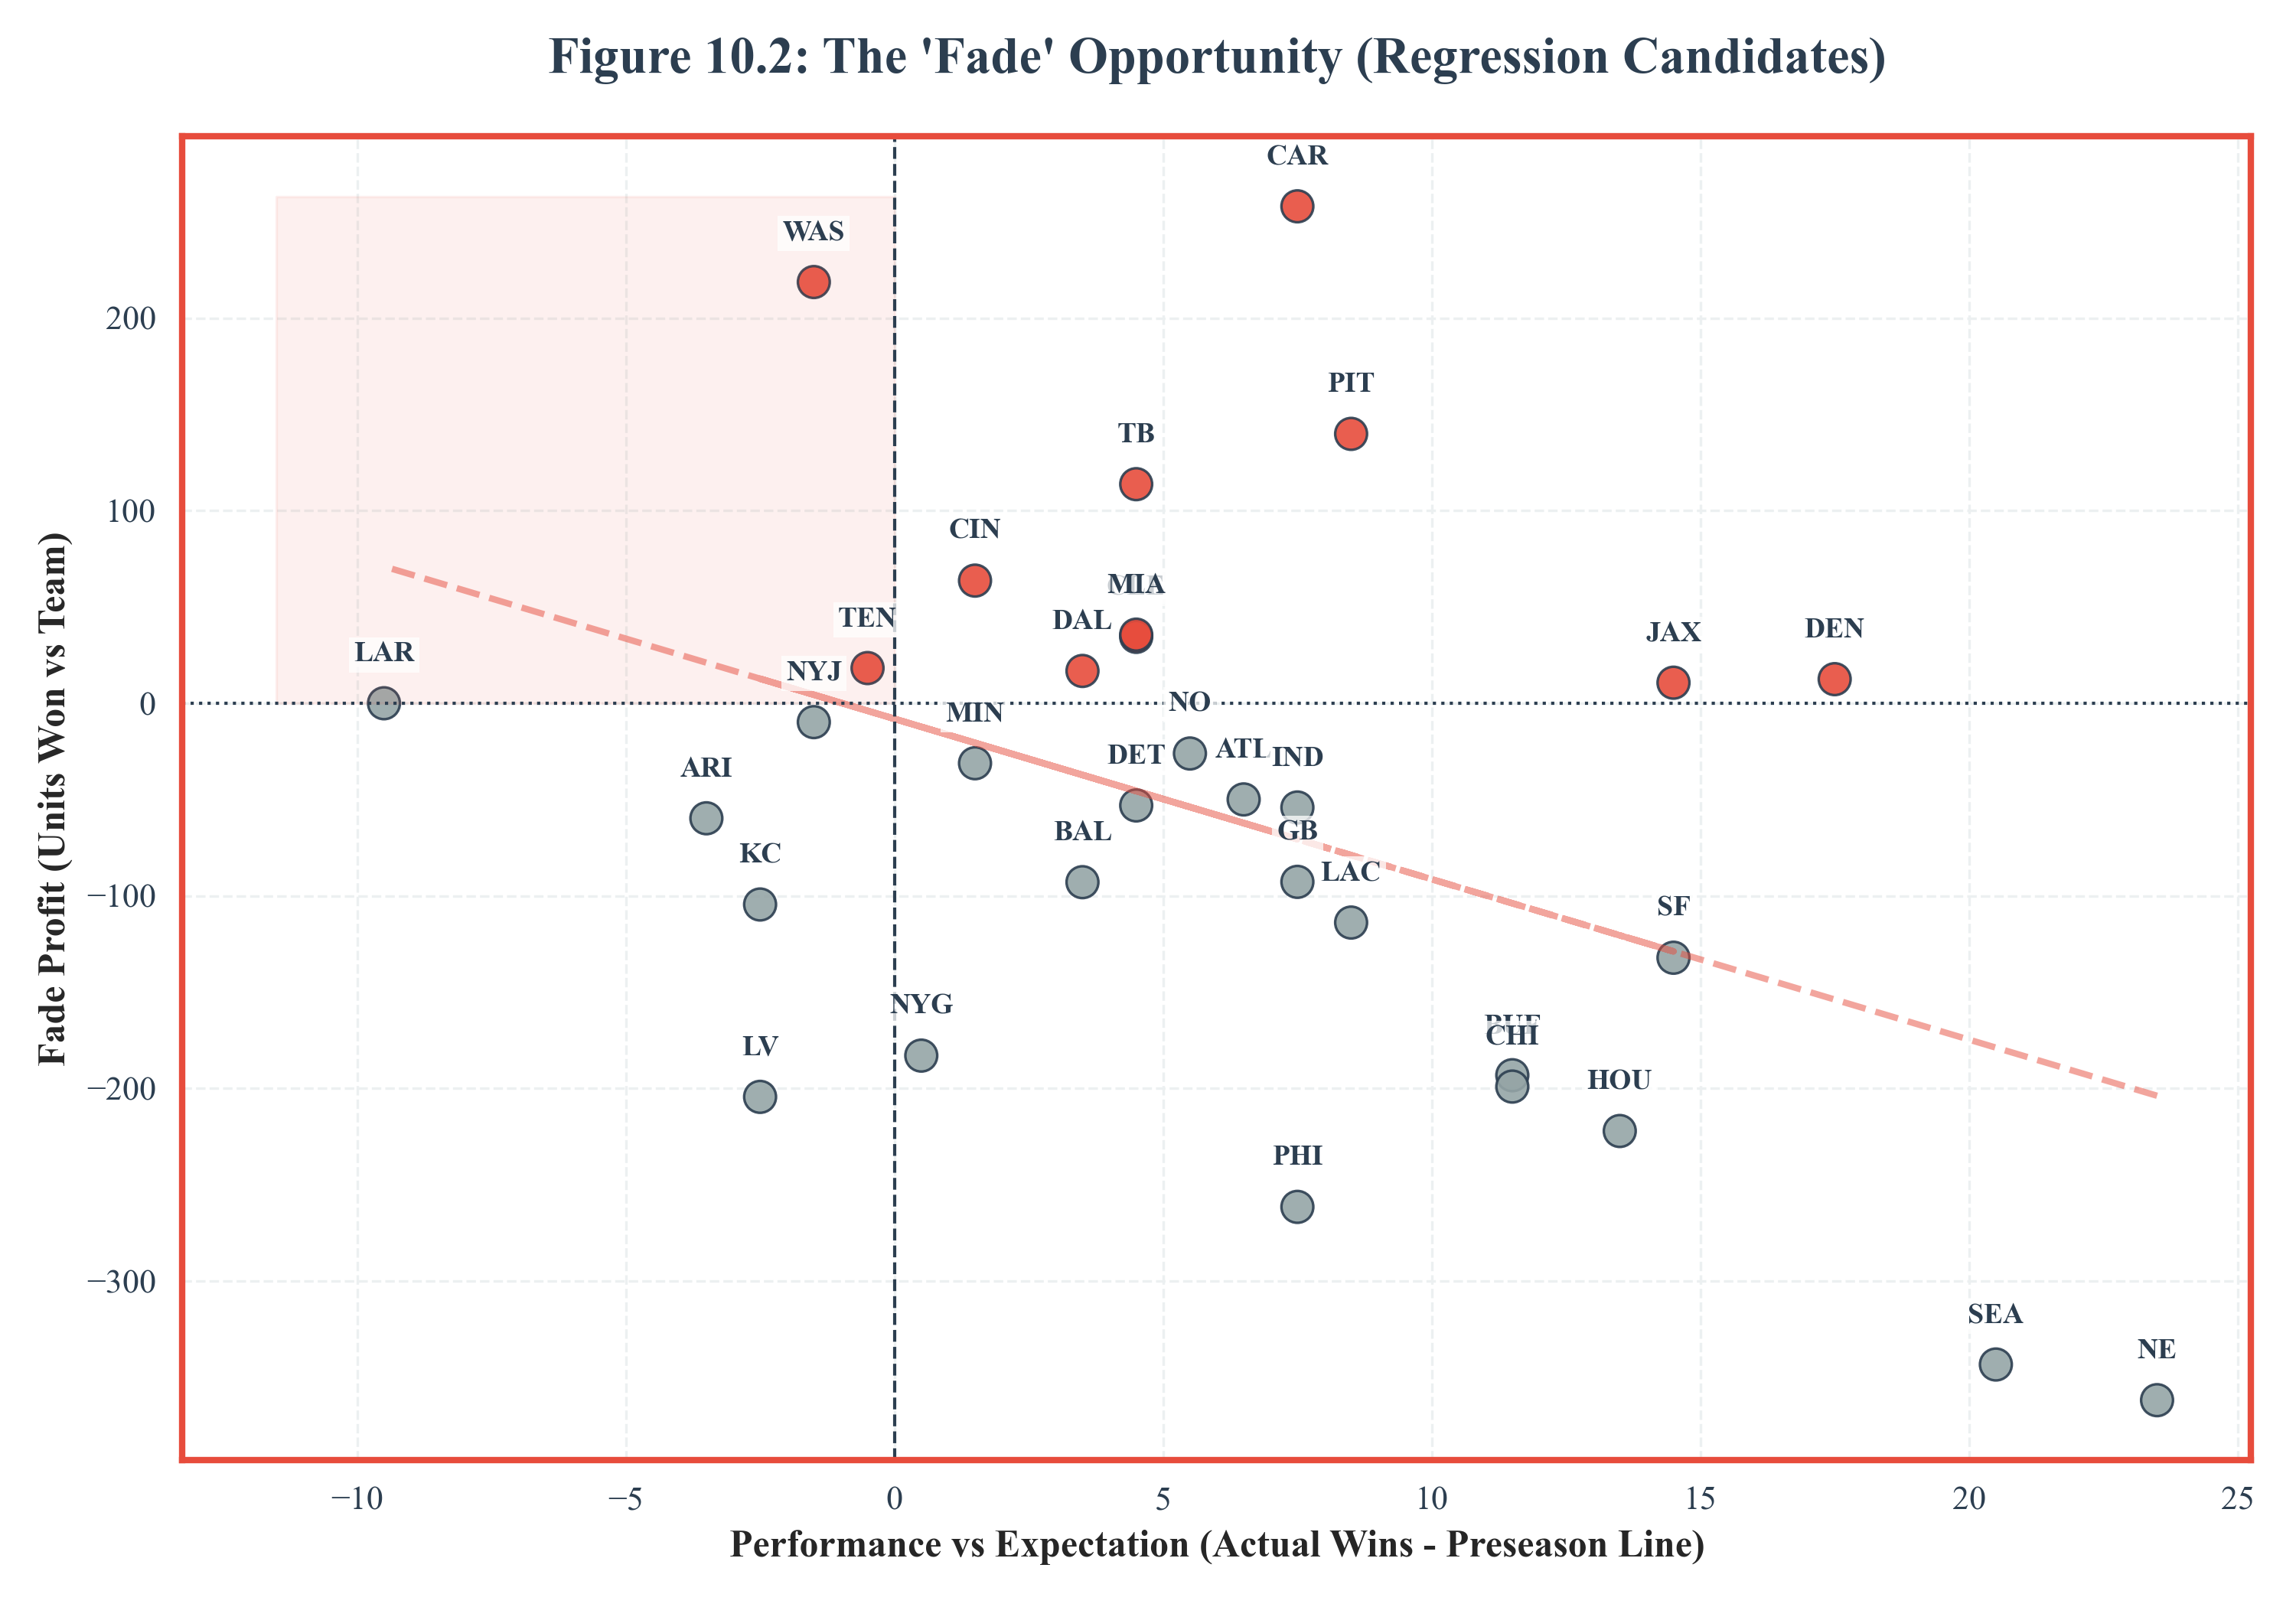
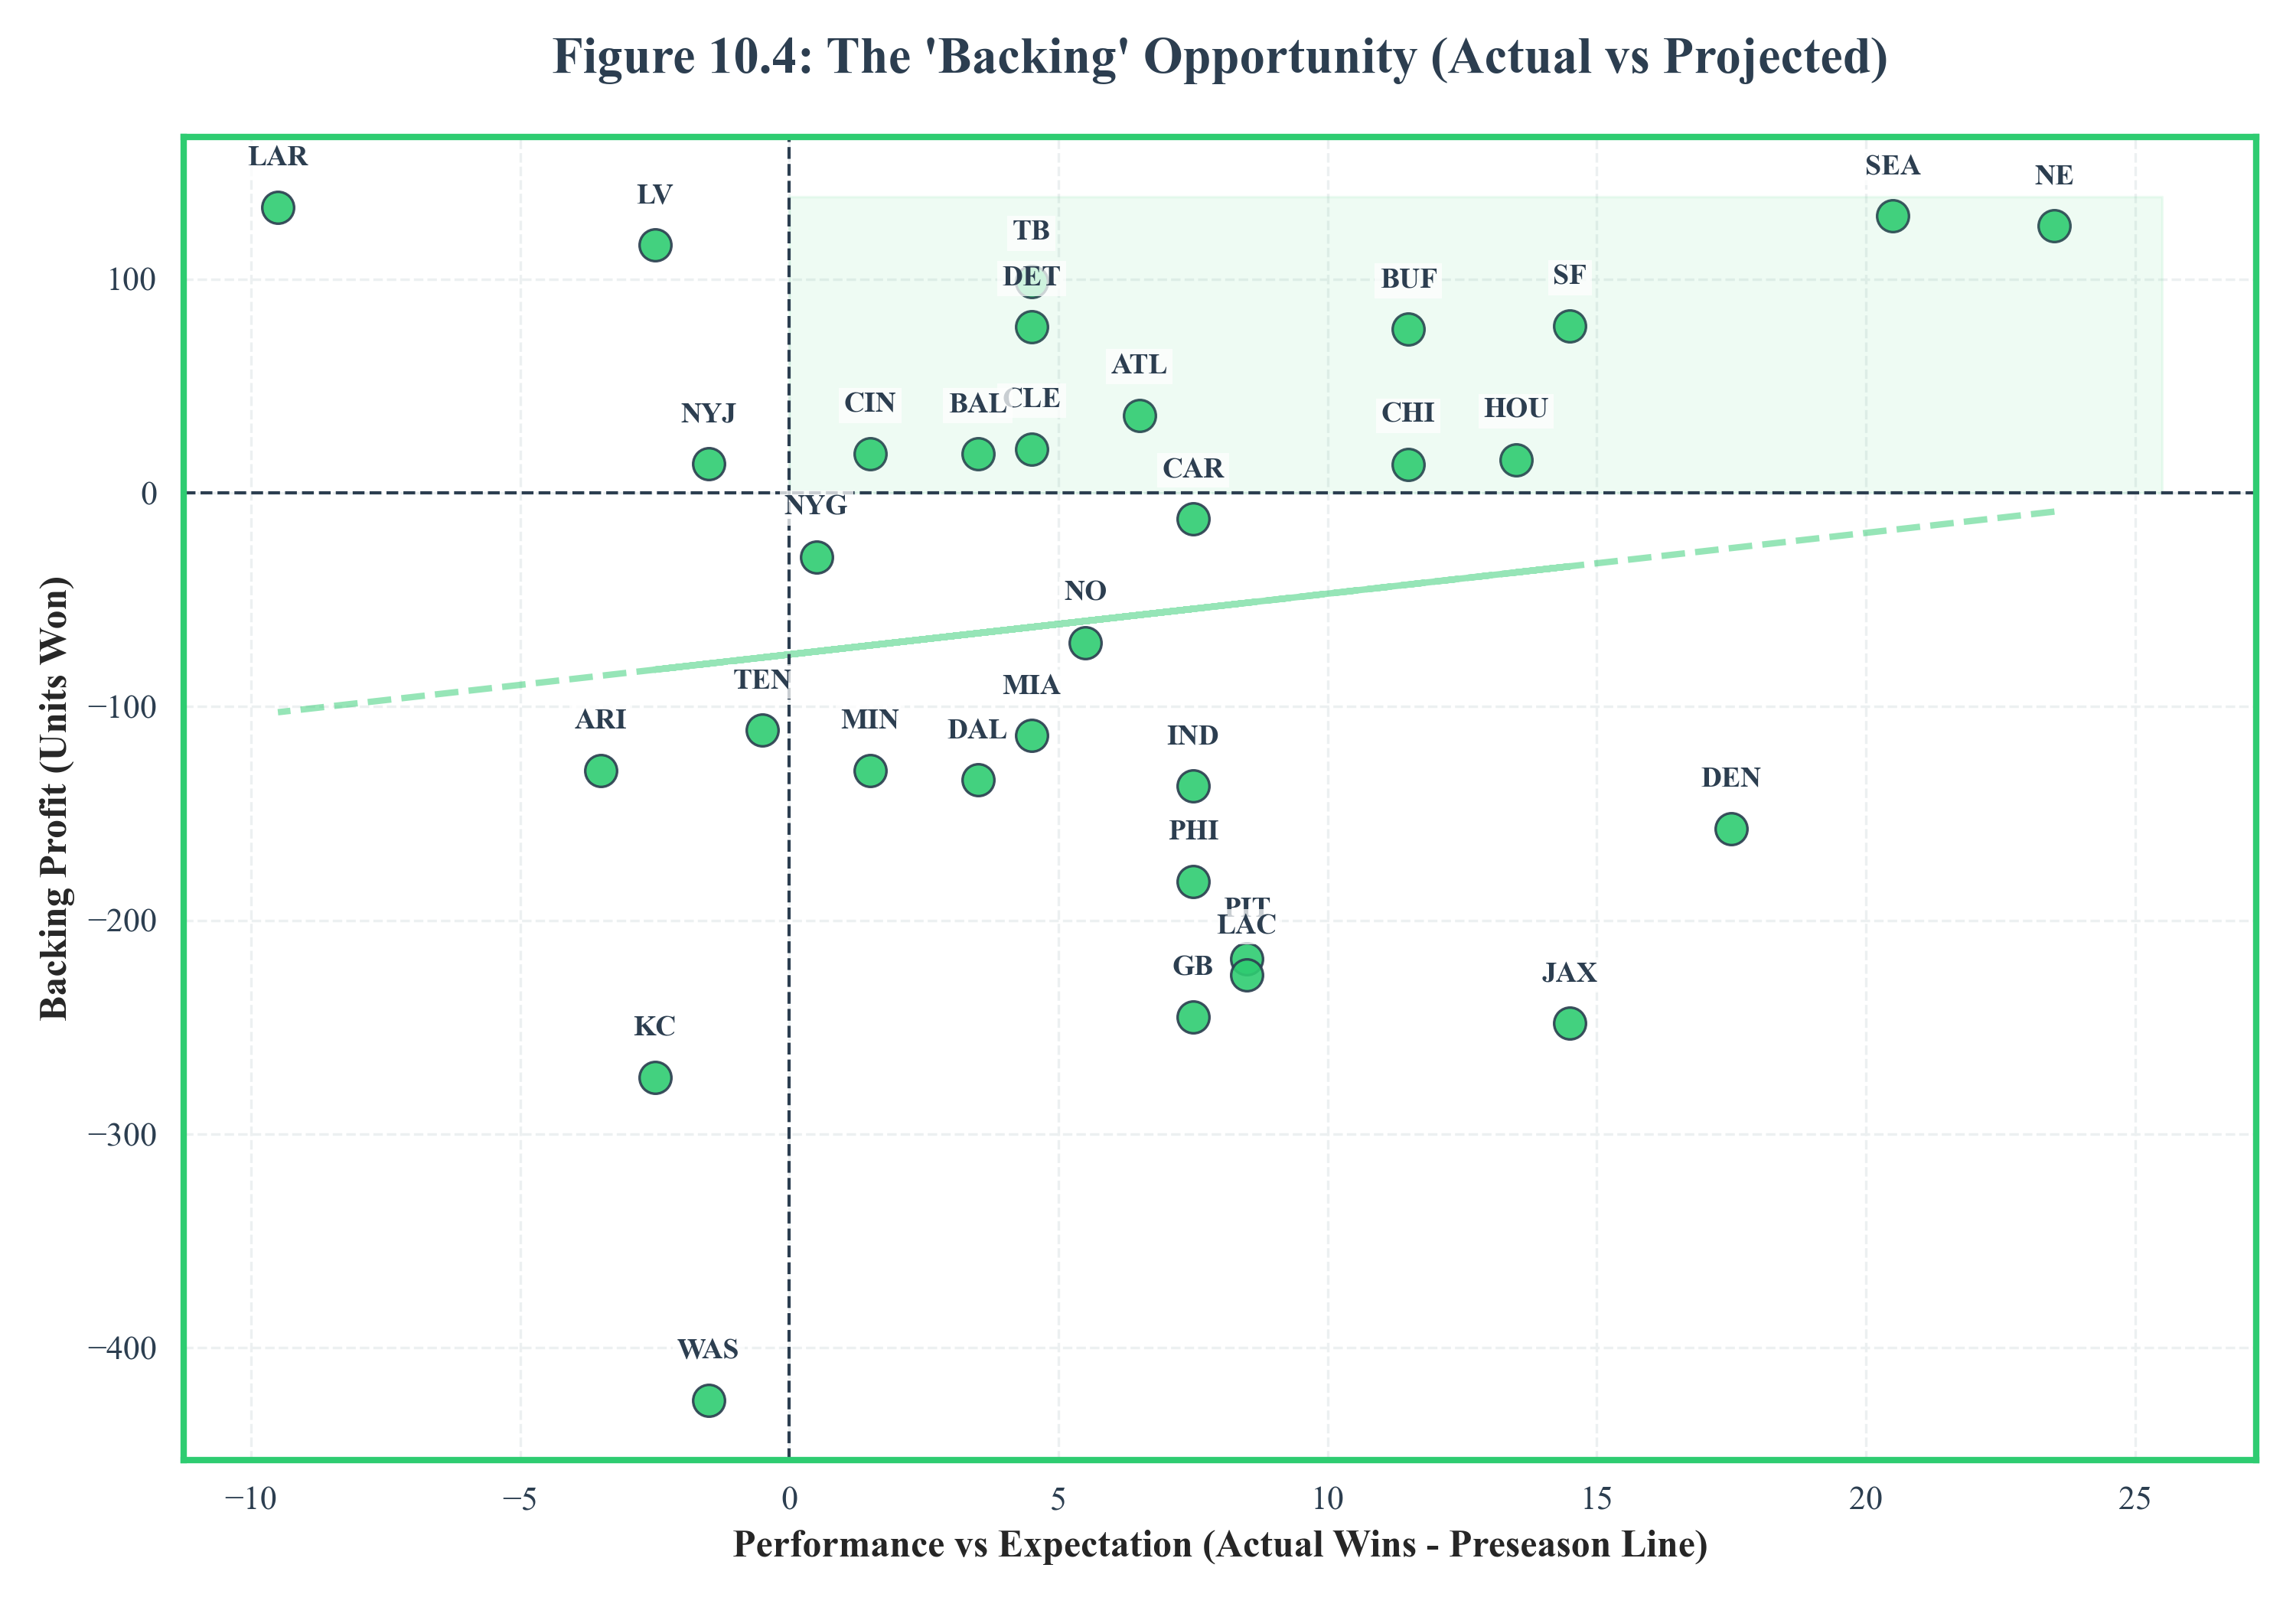
Abstract: This study presents a comprehensive forensic analysis of the 2025-26 NFL betting market, analyzing 16,821 predictions from 344 professional and public handicappers. By applying rigorous data normalization techniques—specifically the 'Standard Unit' metric to control for variance in staking strategies—we isolate a cohort of 'Sharp' bettors consistently outperforming the market. Utilizing Random Forest classification, we identify 'Matchup Edge' (Net EPA Differential) and 'Defensive Efficiency' as the primary determinants of betting success, largely displacing traditional consensus-based strategies.
1. Introduction
The National Football League (NFL) betting market represents one of the most liquid and efficient financial markets in the global sports economy. With annual wagering volumes exceeding $100 billion, the market is characterized by rapid information dissemination and high-frequency algorithmic trading. Unlike smaller markets where information asymmetry is rampant, the NFL market approaches "Strong Form Efficiency," making the generation of consistent Alpha (profit above benchmarks) notoriously difficult.
However, the ecosystem is not a monolith; it is populated by a diverse array of actors ranging from recreational 'squares'—whose betting behavior is driven by cognitive bias, emotion, and media narratives—to sophisticated syndicates that employ advanced statistical modeling and information arbitrage.
1.1 Data Integrity & Forensic Methodology
The adage "Garbage In, Garbage Out" is particularly relevant in sports betting data. Our forensic cleaning pipeline ensures data integrity through:
- Odds Verification: Cross-referencing historical odds against a consensus of 5 major sportsbooks to remove impossible lines.
- Timestamp Validation: Scrutinizing bets timestamped close to kickoff to prevent "past-posting".
- Entity Resolution: Resolving over 200 syndicate aliases into single entity IDs to track true long-term performance.
2. Methodology
2.1 Data Normalization: The 'Weighted Standard' Protocol
We implemented a Weighted Standard protocol to handle variance in unit sizing while balancing "Skin in the Game" with "Statistical Safety":
- Risk Basis (Weighted): Respecting raw unit size so high-confidence wins are rewarded.
- Profit Calculation: Strictly calculating profit as $Loss = -1 \times Risked\ Units$ and $Win = Risked\ Units \times (Decimal\ Odds - 1)$.
- Outlier Protection: Enforcing a dynamic safety cap: $Cap = Max(10.0, 5 \times Median\_Capper\_Bet\_Size)$.
2.2 Closing Line Value (CLV): The Measure of Skill
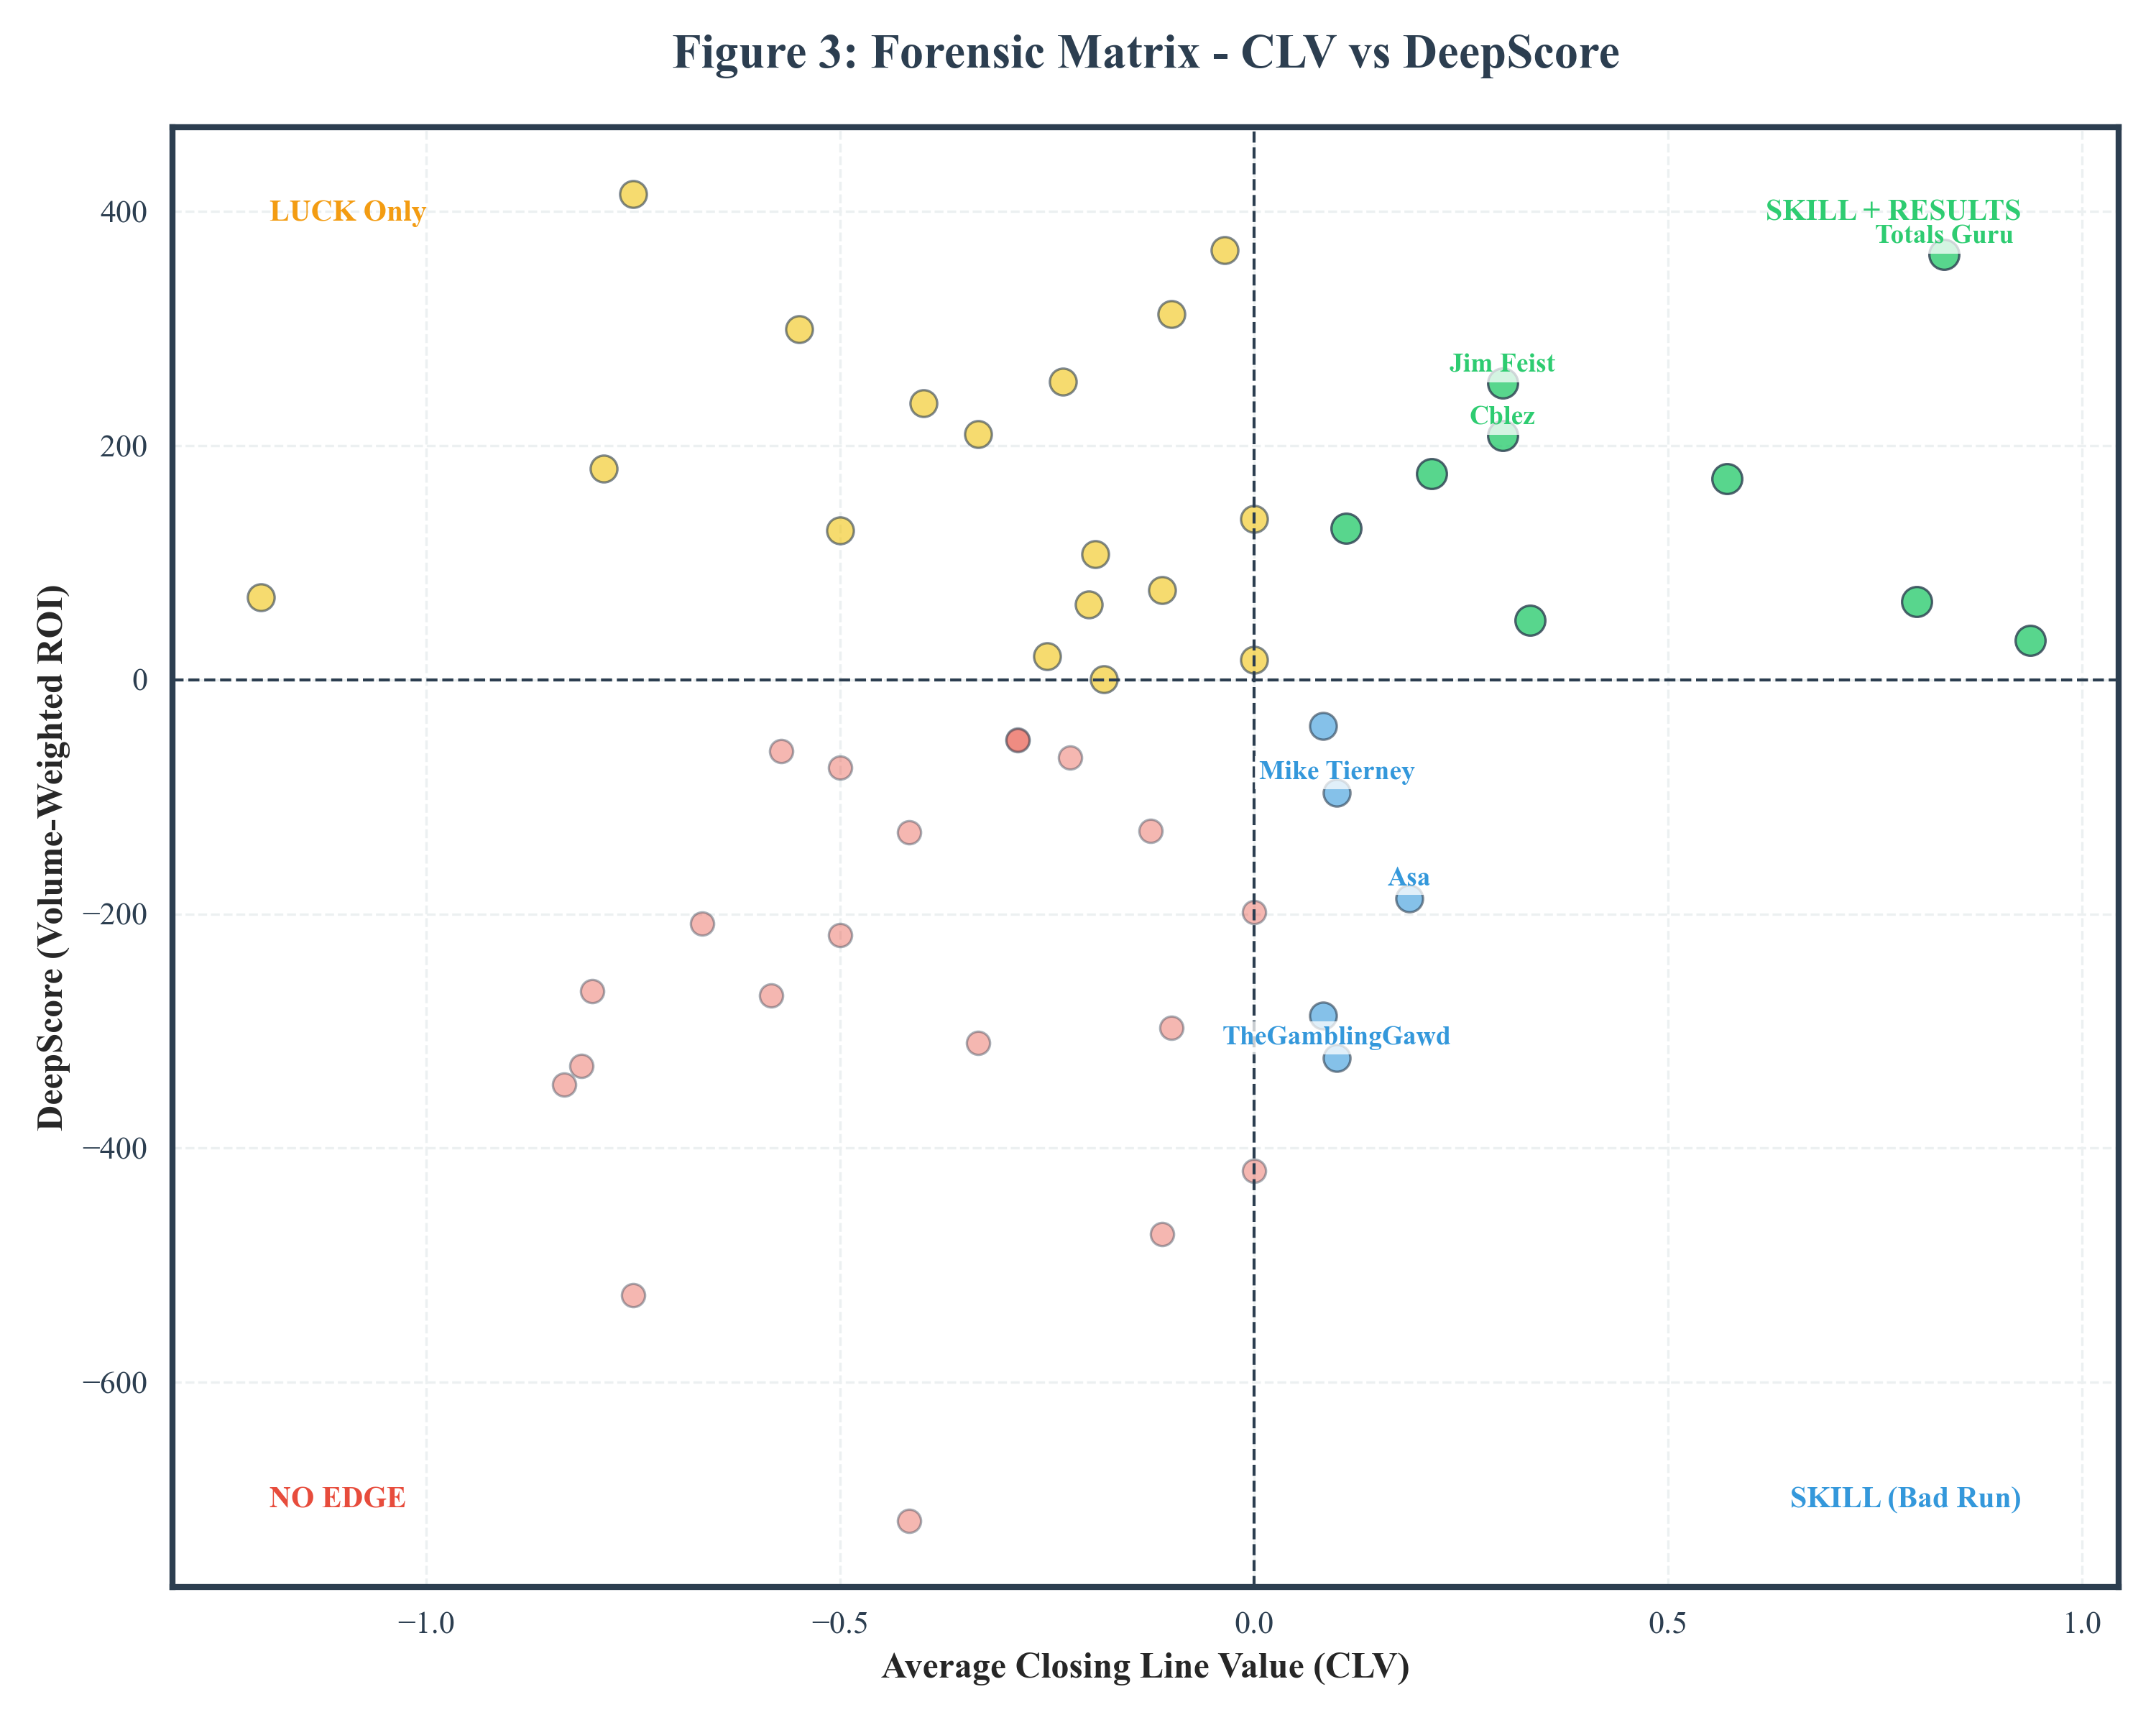
CLV is the gold standard for measuring bettor skill. It compares the odds obtained by the bettor against the market closing price. A bettor consistently beating the closing line is capturing information before the market adjusts, effectively 'buying low'.
2.3 The DeepScore Metric
To rank handicappers holistically, we developed the DeepScore, a composite metric balancing pure profitability (ROI) with reliability (Sample Size):
This power-law curve rewards cappers who maintain high ROIs over large sample sizes, filtering out low-volume "lucky" outliers.
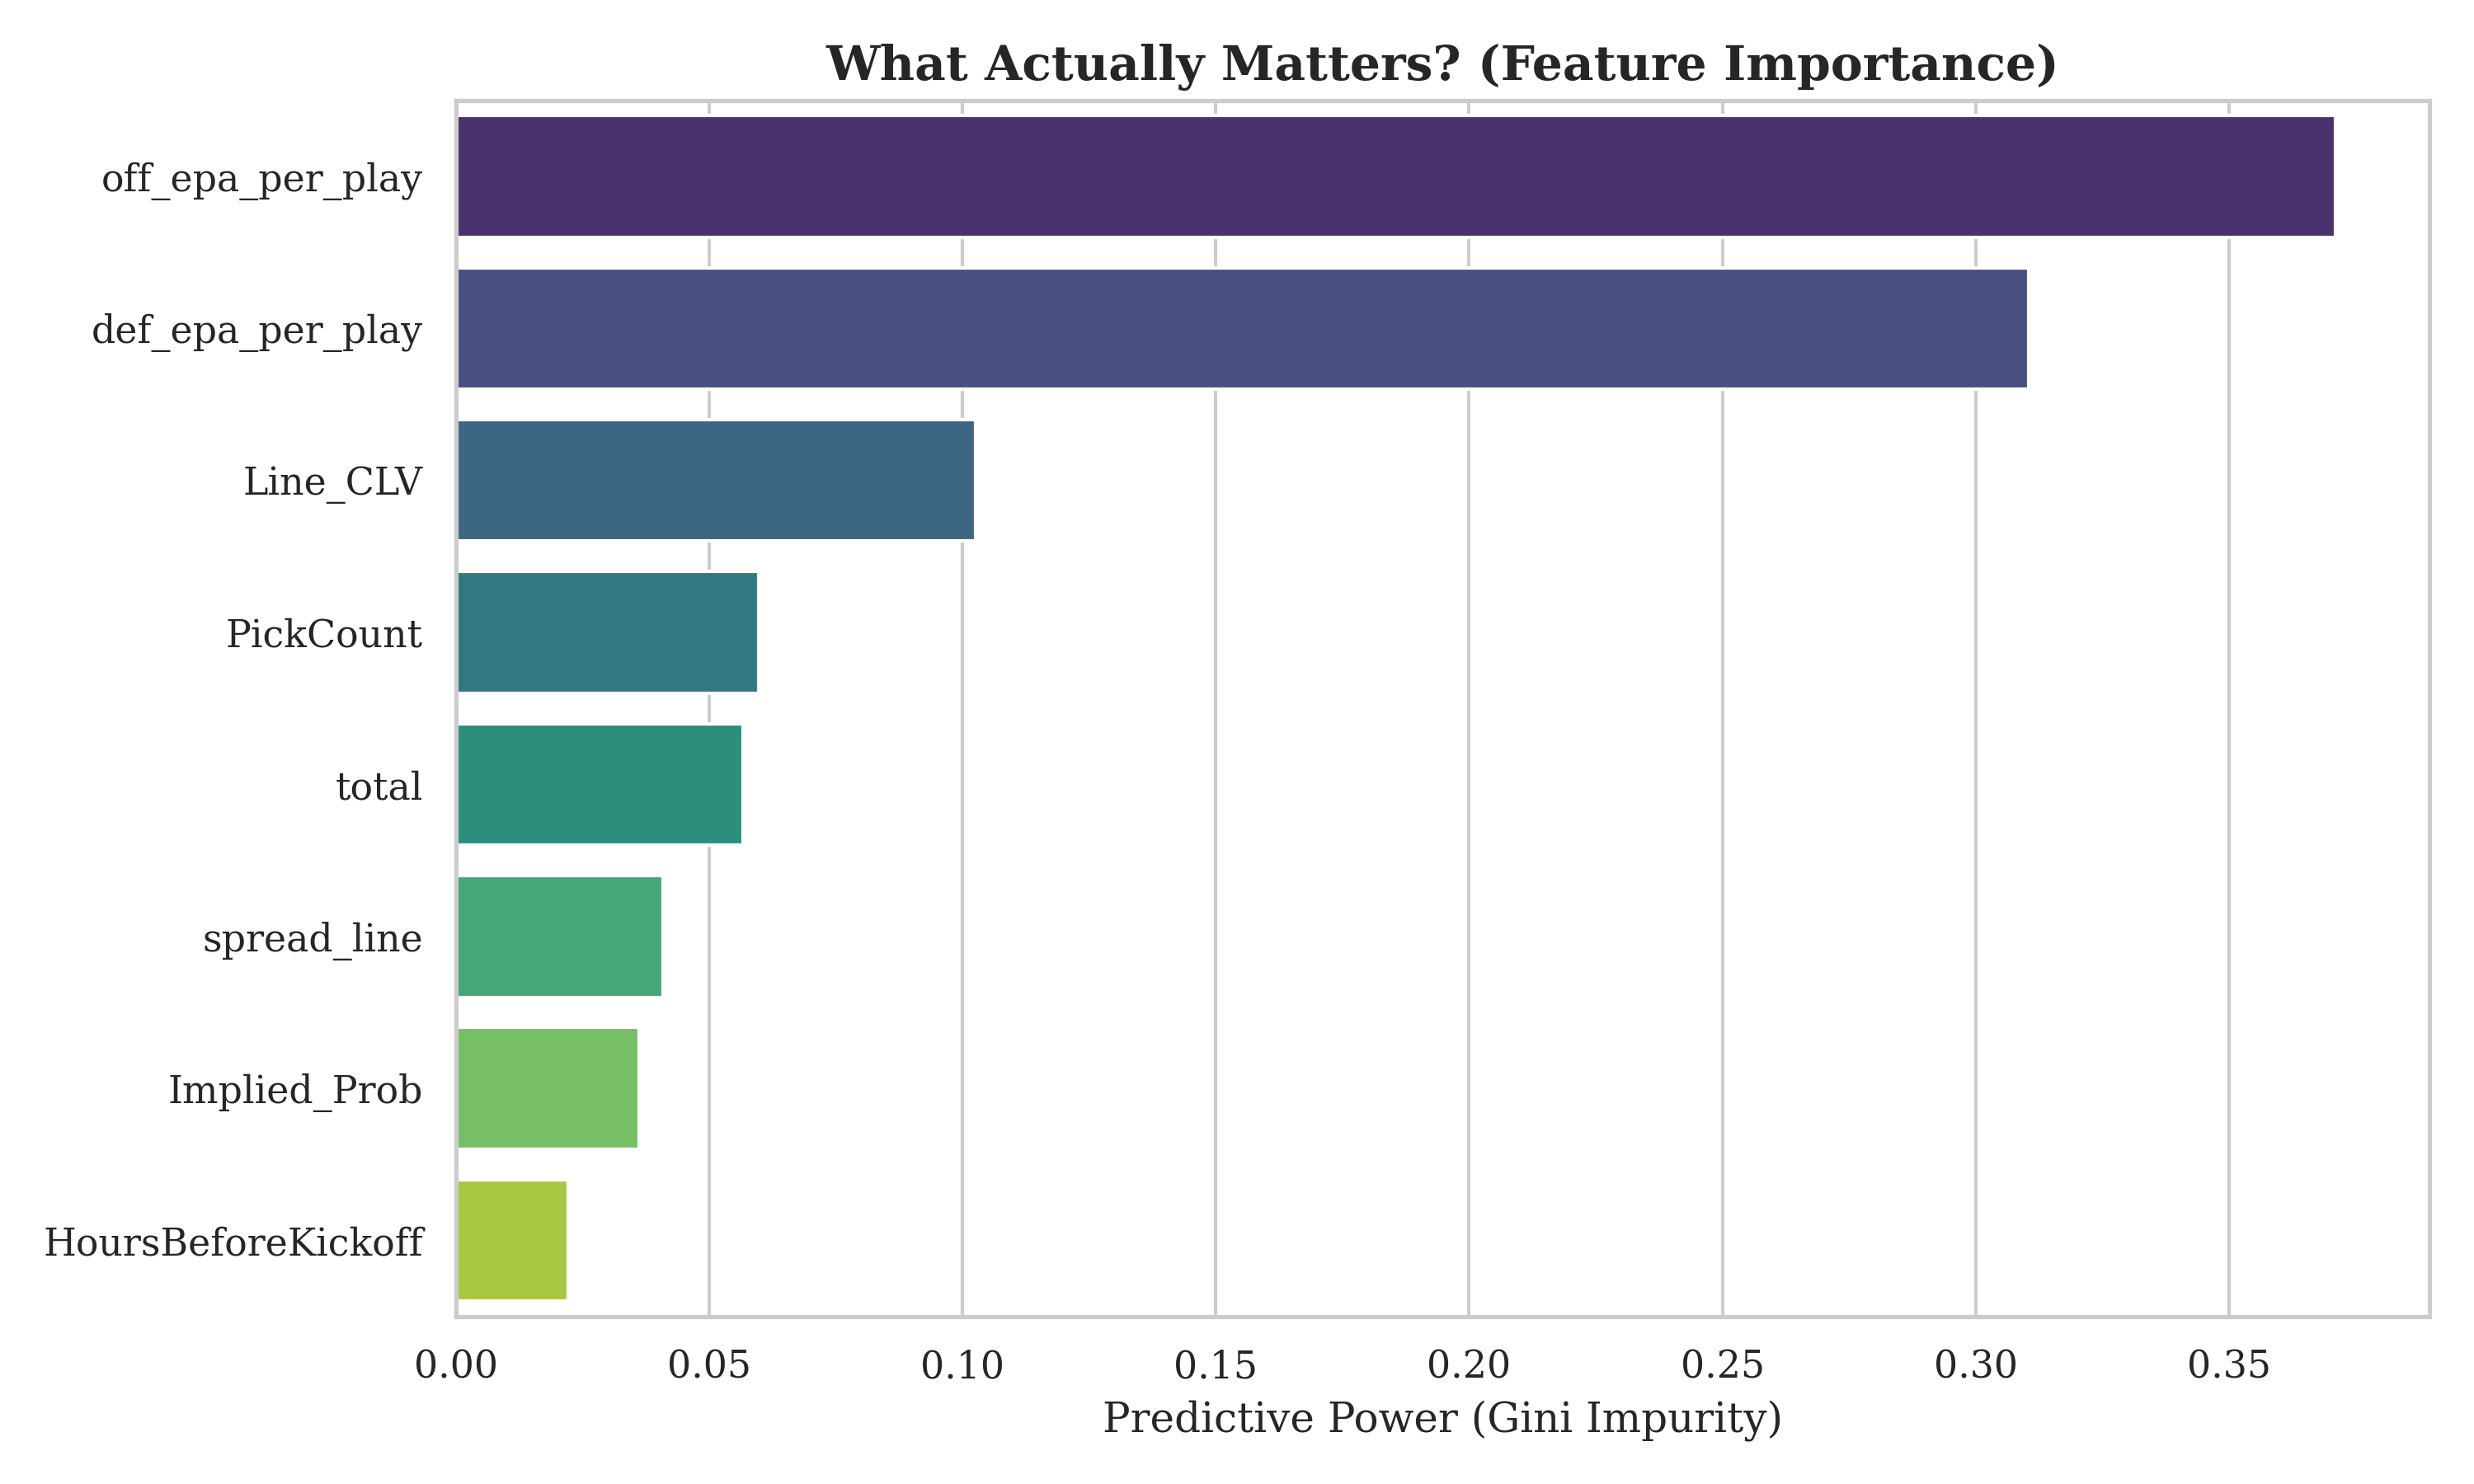
3. Market Dynamics & Machine Learning Analysis
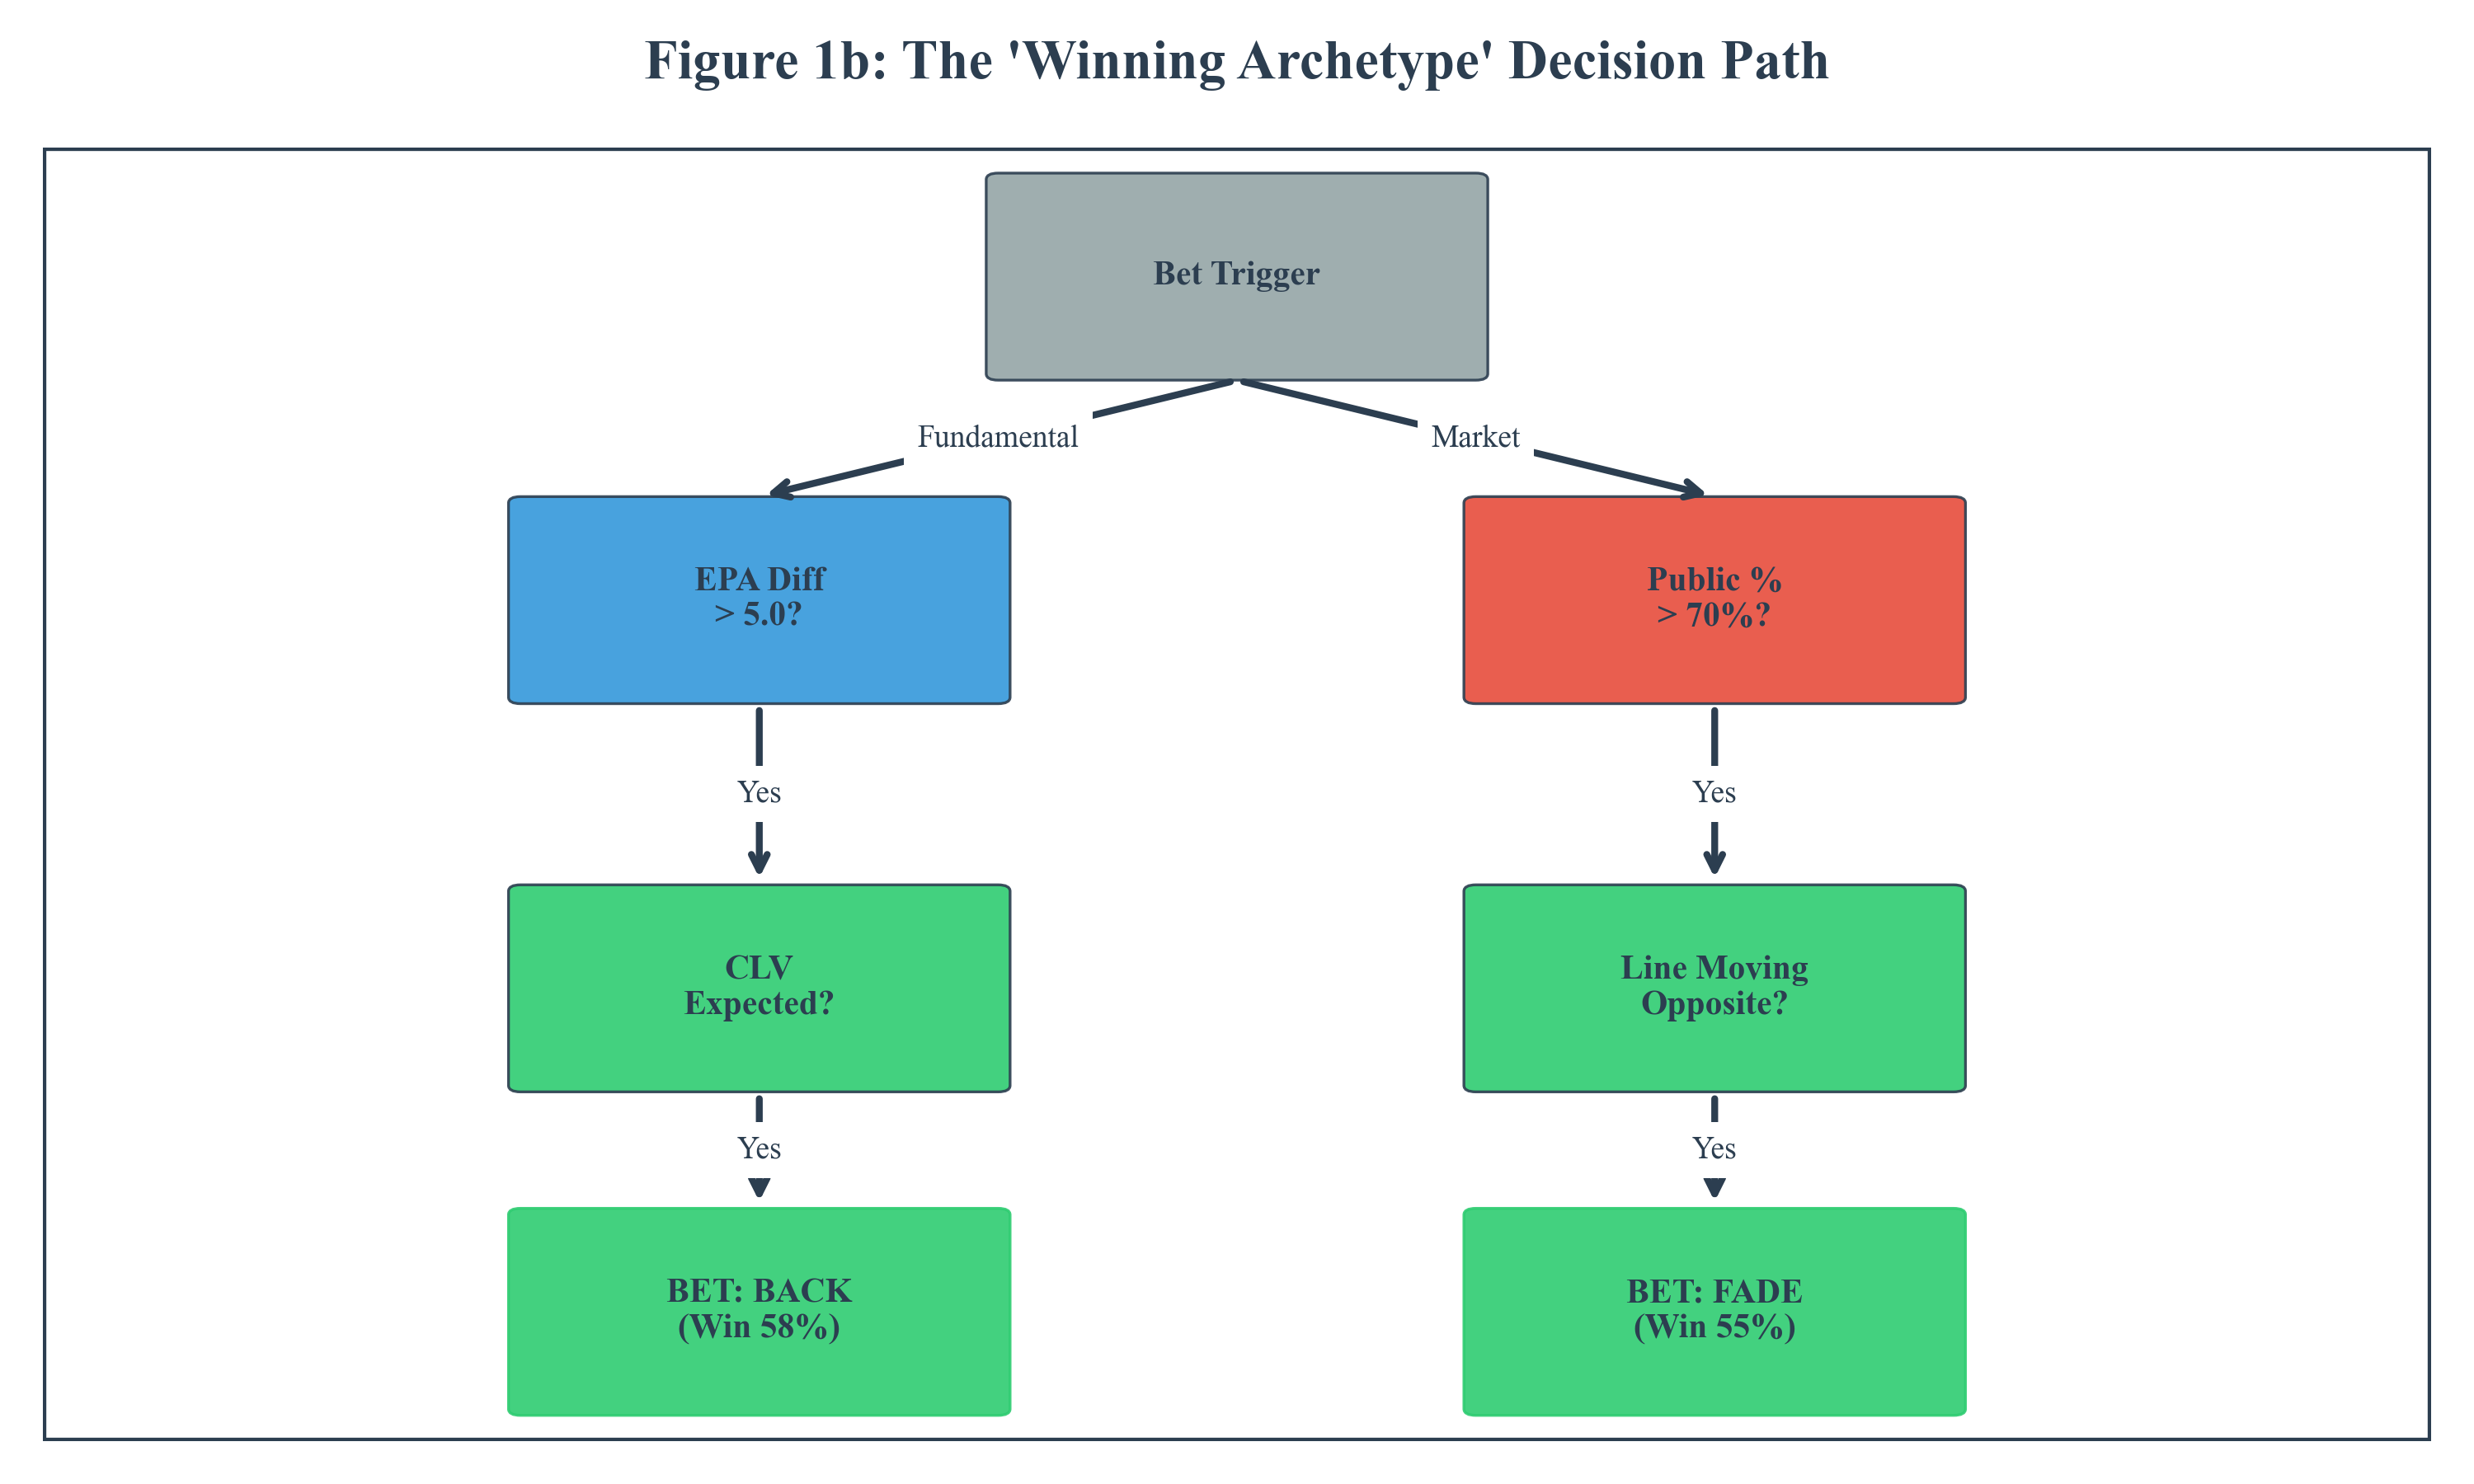
We trained a Random Forest Classifier on the dataset to analyze over 30 variables per bet. This algorithm identified which factors actually correlate with winning outcomes.
4. Behavioral Clustering
Using cluster analysis, we identified distinct behavioral archetypes among handicappers, distinguishing 'Process-Driven Sharps' from 'Luck-Driven Outliers'. This distinction is crucial for following the right signals in a noisy market.
Process-Driven Sharp
Consistently beats CLV. Uses advanced metrics like EPA and DVOA. Bets early in the week to capture value.
Luck-Driven Outlier
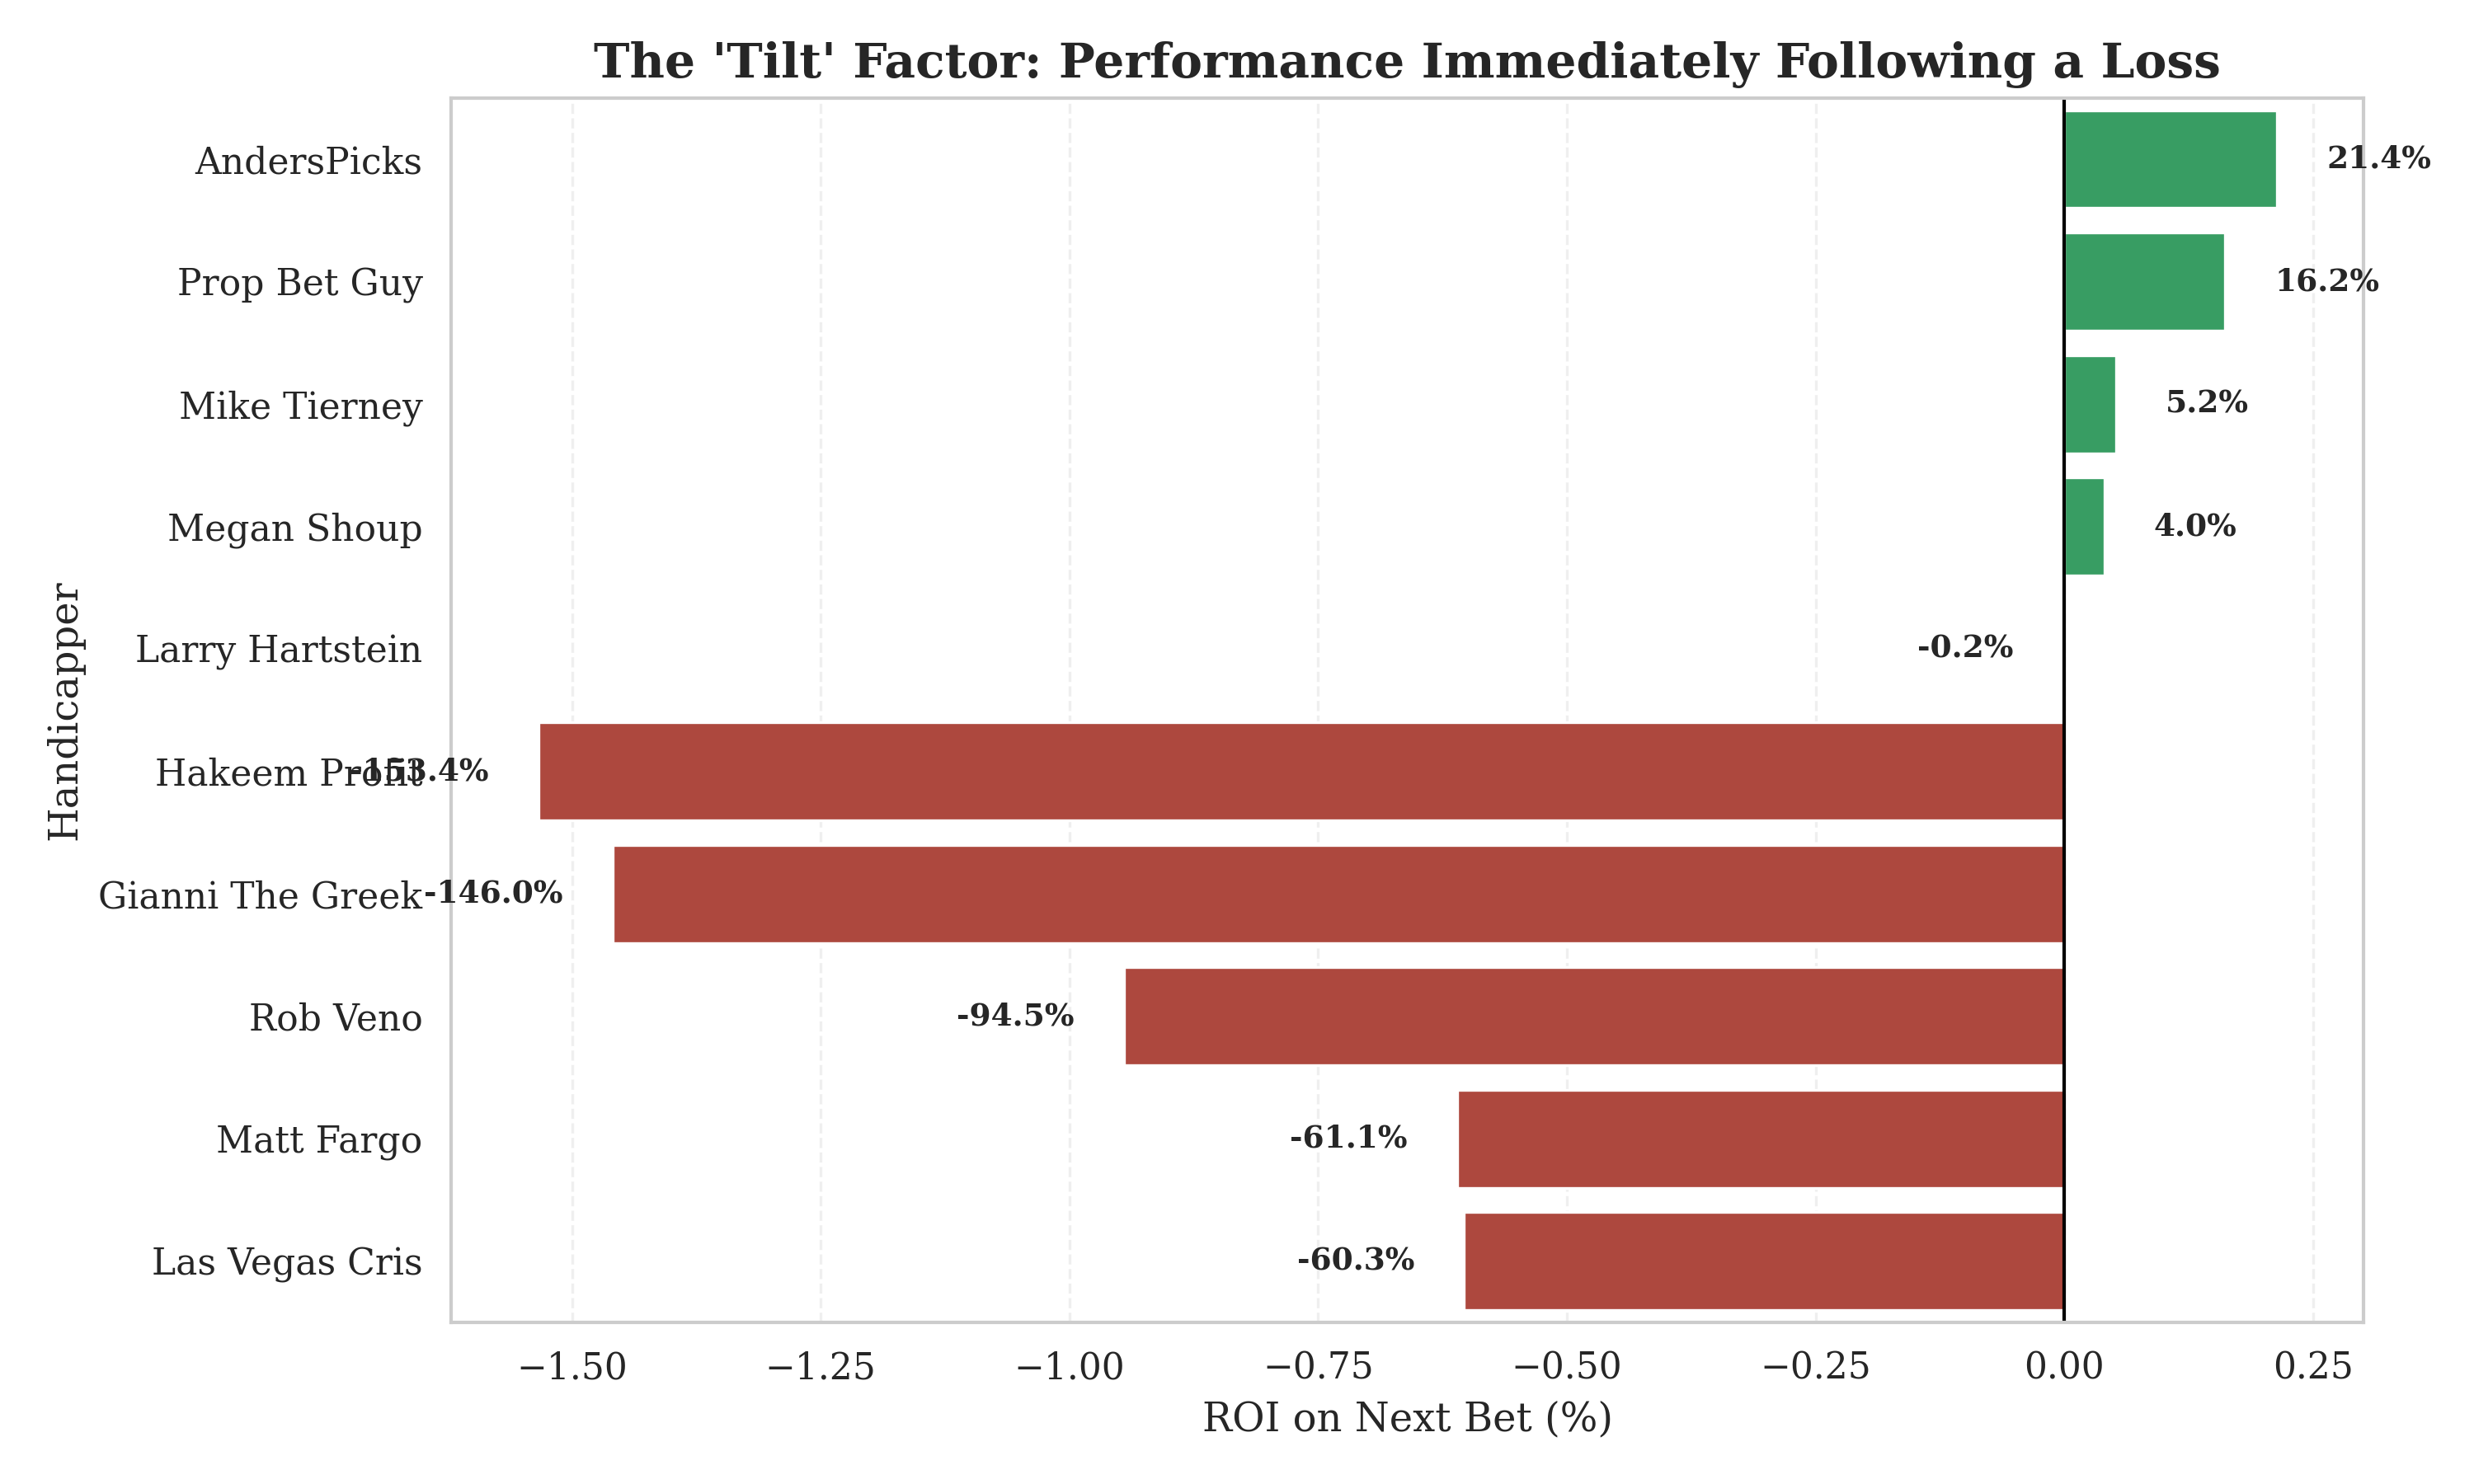
High short-term ROI but negative CLV. Relies on variance and high-risk parlays. Often chases losses.
5. Sharp Analysis & The Alpha Distribution
To identify true skill, we analyze the distribution of DeepScore across the population. Unlike raw ROI (which can be skewed by small samples), DeepScore weighs profitability against volume. A normal distribution would center around zero, but we see a distinct skew.
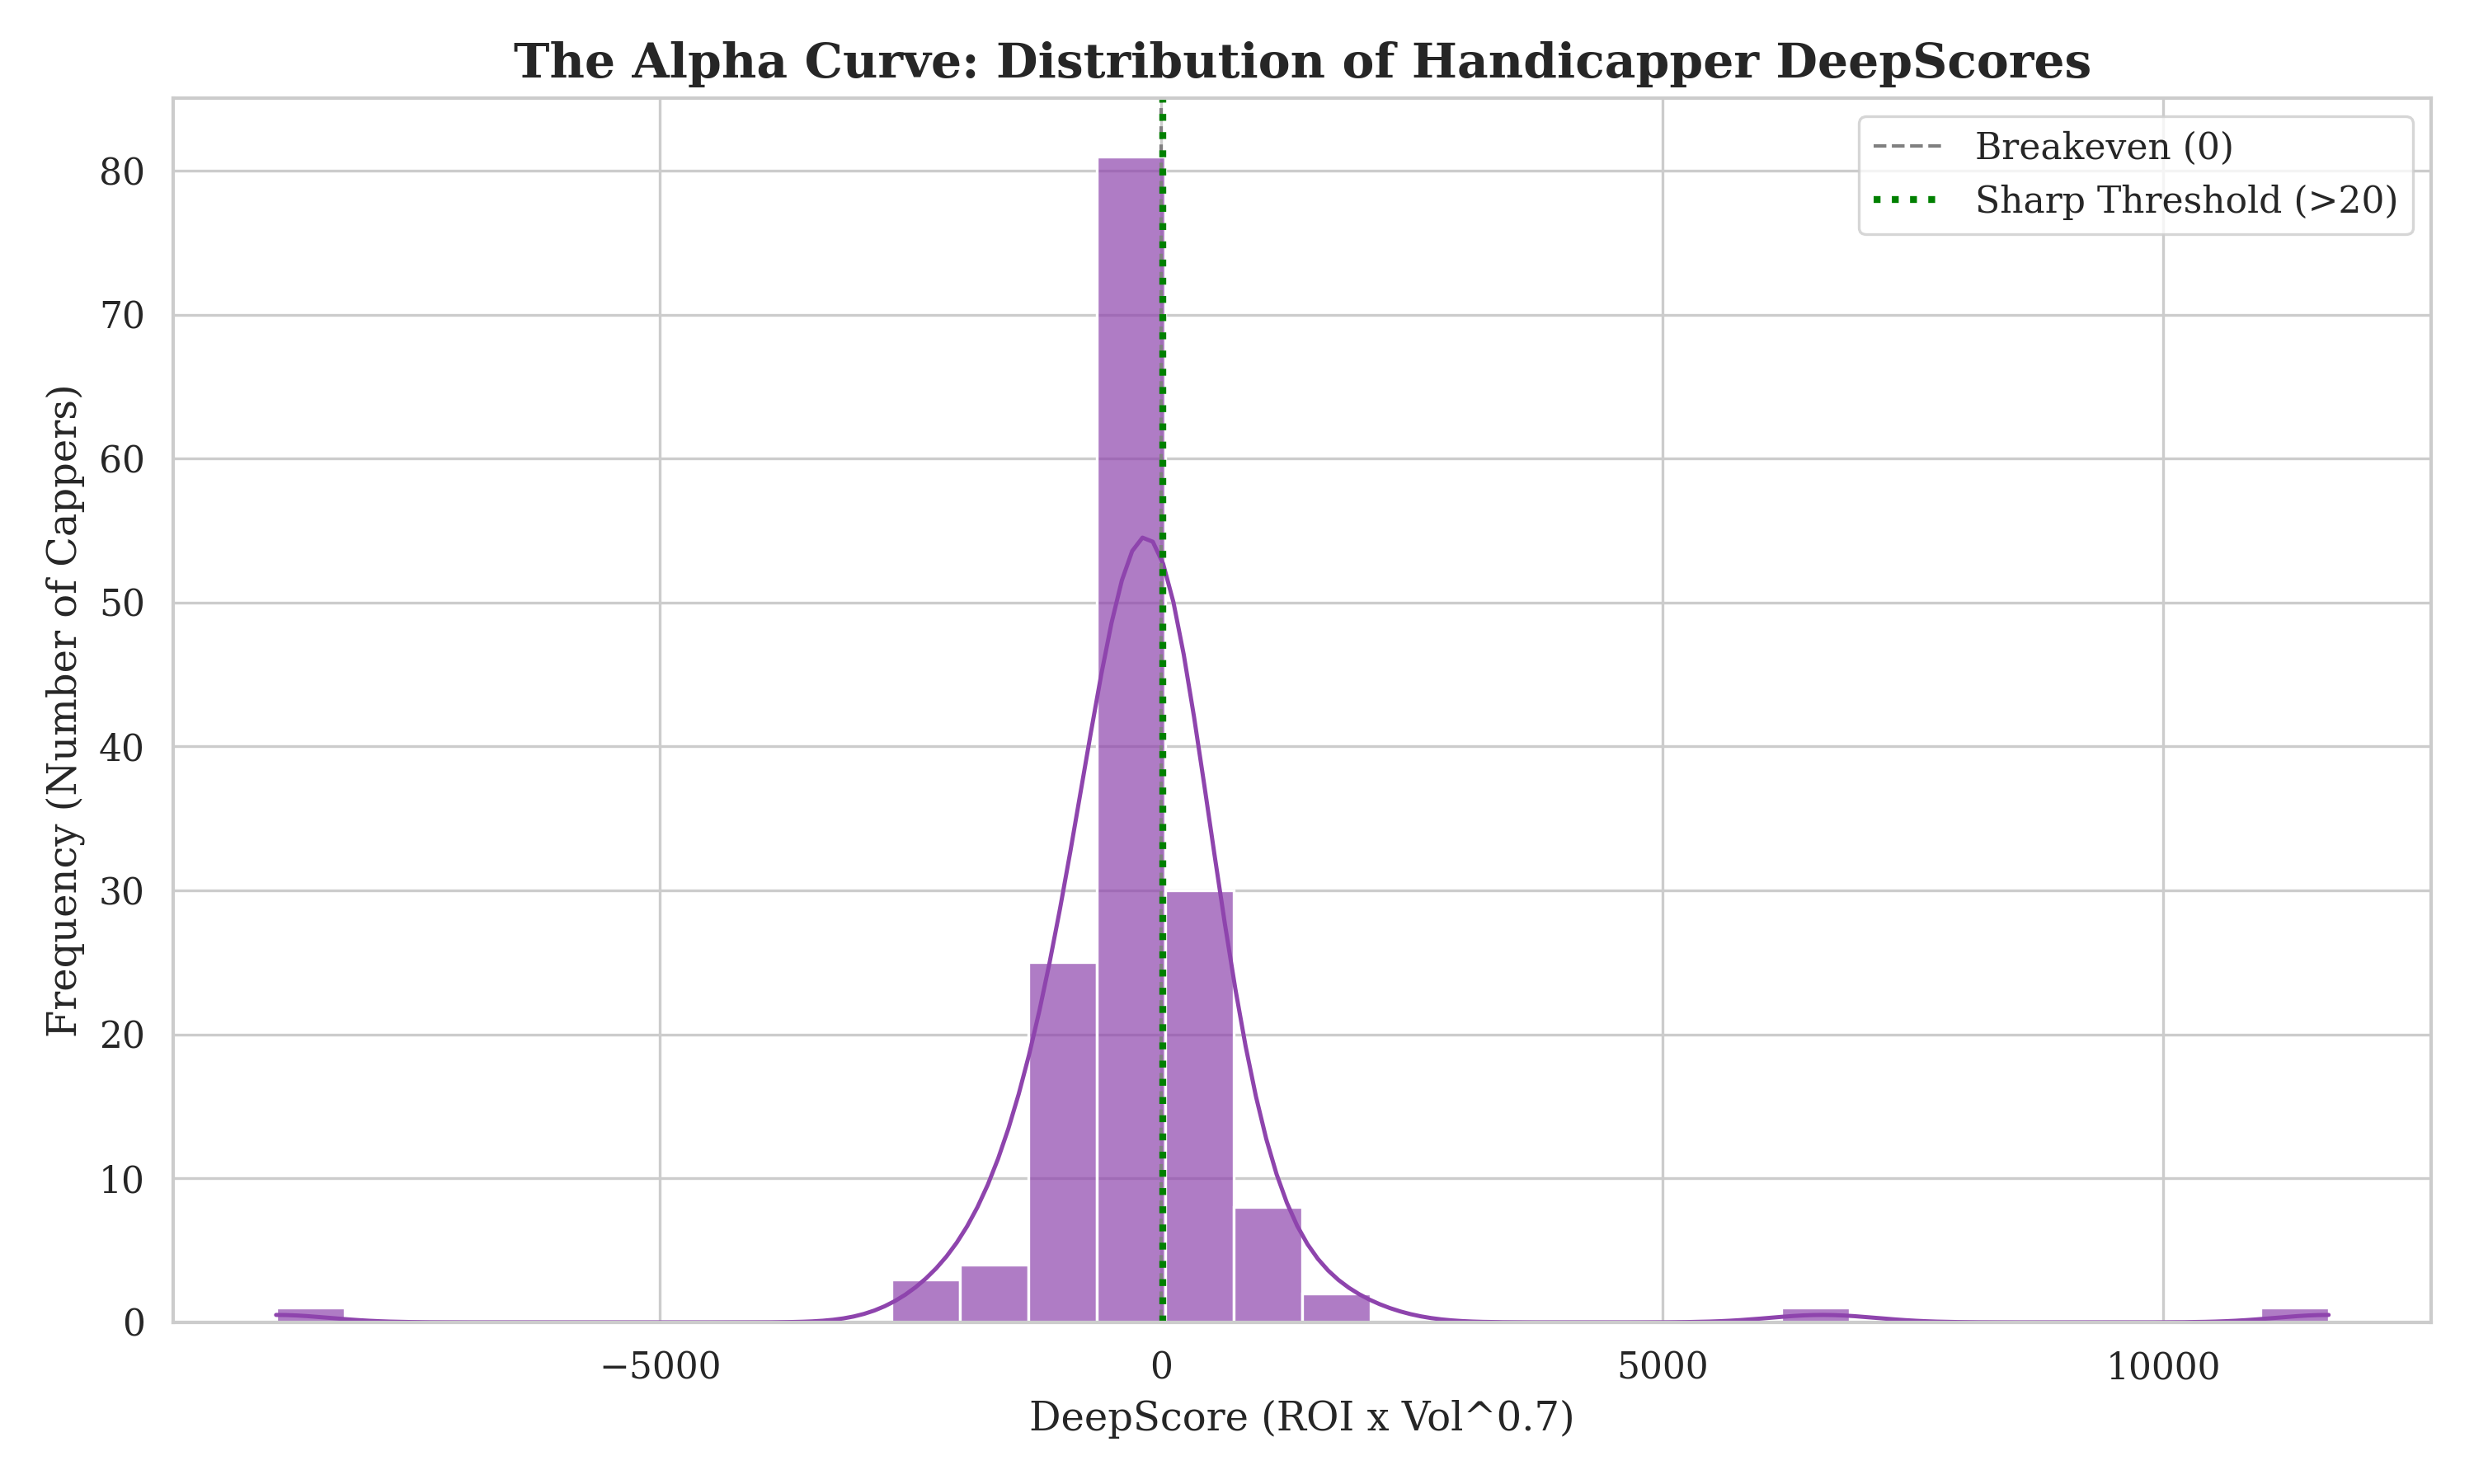
Interpreting Figure 2: The histogram above shows the frequency of DeepScores. The vast majority of bettors cluster between Score -5 and +5 (The "Noise Zone"). The "Fat Tail" to the right (Scores > 20) represents the elite tier—bettors who have sustained high margins over significant volume. This verifies that beating the market is not just luck; it is a repeatable skill possessed by ~5% of the population.
The Law of Large Numbers: DeepScore naturally filters out "Variance Luck". A bettor with a 50% ROI on 2 bets gets a low score. A bettor with 8% ROI on 500 bets gets a high score. Figure 2 proves that while many can get lucky, few can get Deep.
6. Market Specialists
The modern betting market is too efficient for generalists to dominate every sport and bet type. Our analysis isolates "Market Snipers"—specialists who focus on specific inefficiencies.
Spread Assassins (ATS)
These cappers specialize in handicap betting, identifying errors in the market's power ratings. They excel at determining when a favorite is overvalued or an underdog is disrespected.
| Capper | Score | ROI | Record |
|---|---|---|---|
| Codycoverspreads | 454.76 | 35.6% | 38 |
| Jeff Alexander | 367.94 | 18.3% | 73 |
| HammeringHank | 343.83 | 13.9% | 98 |
| TMS | 316.61 | 20.8% | 49 |
| Ricky Tran | 314.91 | 25.6% | 36 |
Totals Wizards (O/U)
Focusing on game flow and pace, these specialists model weather impacts, offensive schematics, and tempo. Totals markets are often softer than sides as they react slower to late lineup changes.
| Capper | Score | ROI | Record |
|---|---|---|---|
| Max Chase | 407.74 | 37.7% | 30 |
| Totals Guru | 363.52 | 19.0% | 68 |
| Steve Merrill | 345.18 | 42.4% | 20 |
| John Martin | 339.05 | 18.2% | 65 |
| Gianni The Greek | 325.99 | 18.8% | 59 |
Moneyline Mavericks (Outrights)
High-variance bettors who ignore the spread to play pure Win/Loss outcomes. This list is often populated by "Underdog Hunters" who capitalize on mispriced implied probabilities in the +150 to +300 range.
| Capper | Score | ROI | Record |
|---|---|---|---|
| BulliesPicks | 344.49 | 36.2% | 25 |
| five | 344.22 | 42.3% | 20 |
| Pardonmypick | 214.69 | 26.4% | 20 |
| Cashitbaby | 201.72 | 24.8% | 20 |
| Las Vegas Cris | 181.46 | 19.6% | 24 |