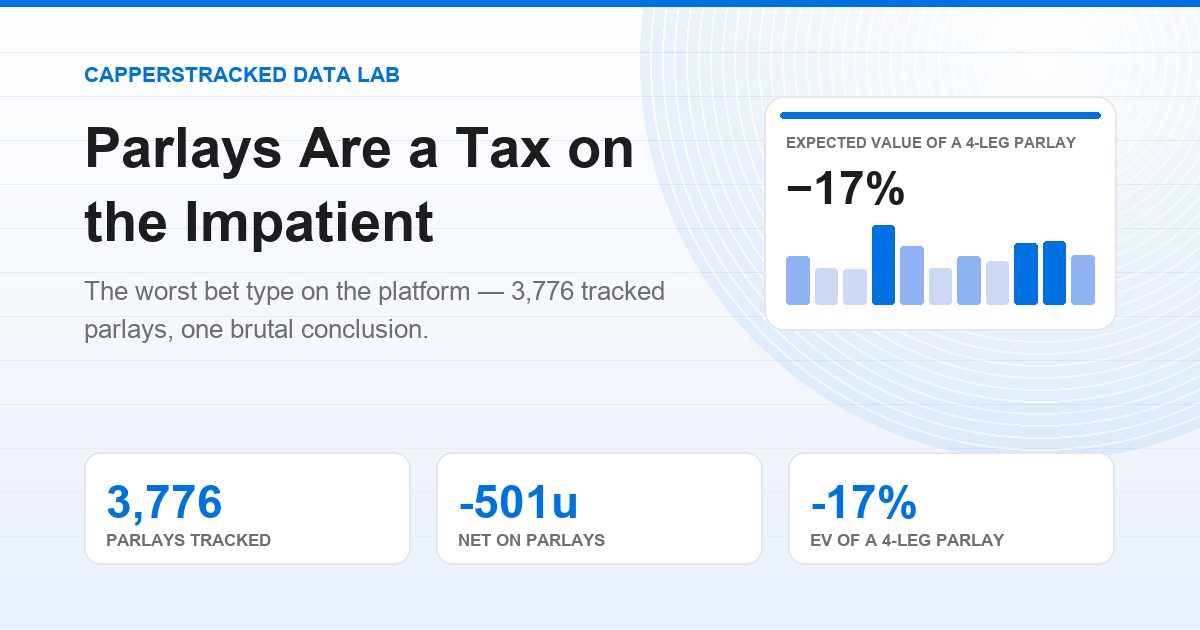
In our dataset, parlays are the worst bet type on the entire platform — 3,776 tracked parlays, down -500.9 units, while the same population's spread bets are up +1,196.0 units. This is not bad luck. It is math.
The data: every figure below is computed from the CappersTracked dataset — 1,460 tracked handicappers, 170,170 graded picks, 372 currently graded (protected variant). Snapshot: 2026-07-29. Simulations are Monte Carlo runs with a fixed seed — every chart in this series is reproducible.
1. The Real Numbers
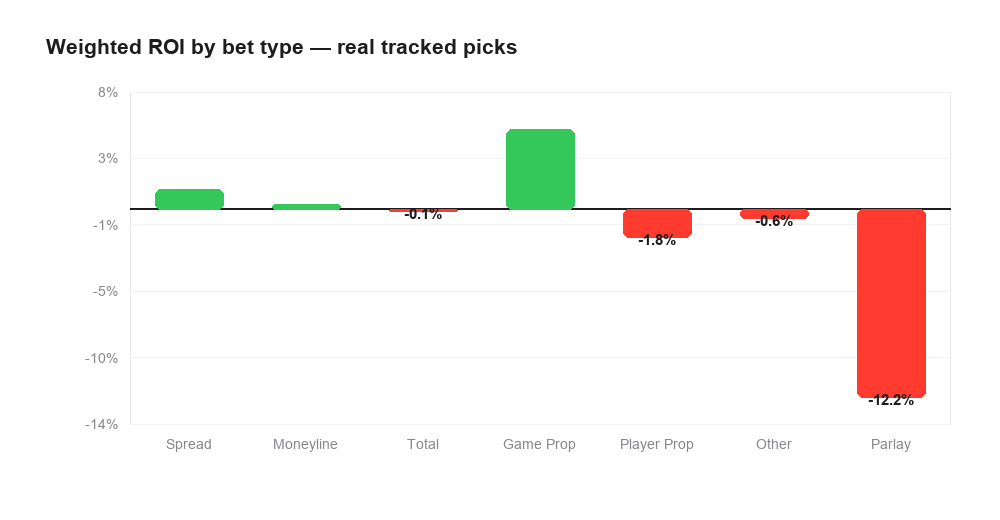
We aggregated every graded pick in the CappersTracked dataset by bet type and computed the weighted ROI (standardized units):
| Bet type | Picks | Net units | Weighted ROI |
|---|---|---|---|
| Spread | 79,650 | +1196.0u | +1.3% |
| Moneyline | 65,585 | +216.1u | +0.3% |
| Total | 49,294 | -74.6u | -0.1% |
| Game Prop | 1,518 | +76.3u | +5.2% |
| Player Prop | 11,385 | -202.9u | -1.8% |
| Other | 7,160 | -47.1u | -0.6% |
| Parlay | 3,776 | -500.9u | -12.2% |
2. Why: The Vig Compounds
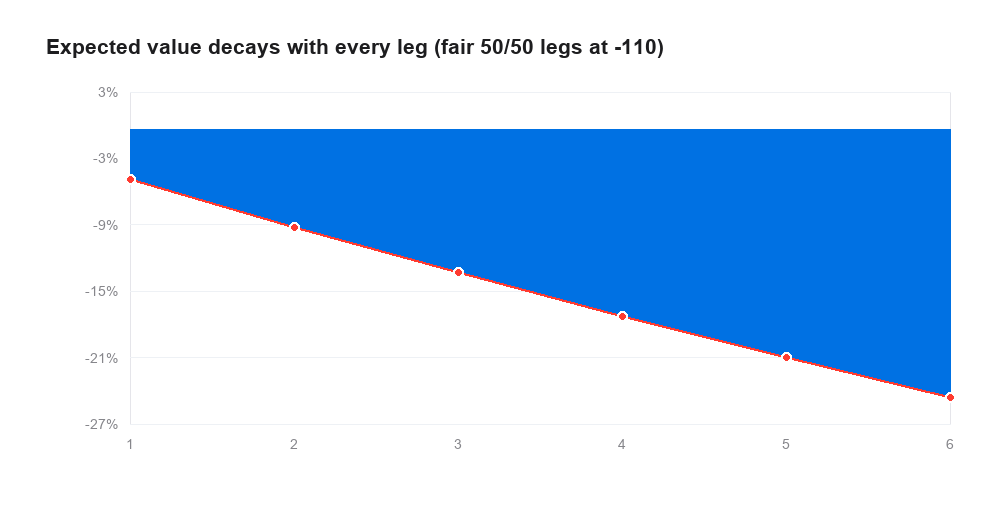
A single -110 bet pays $0.91 per $1 risked and carries a built-in 4.55% hold. String k of those legs together and the house edge multiplies, not adds:
One leg costs you 4.5%. Two legs cost 8.9%. Four legs cost 17%. You are not combining edges — you are compounding the tax.
| Bet | Expected return | Cost per $100 | Cost of a daily $10 bet / year |
|---|---|---|---|
| 1-leg parlay | -4.5% | $4.55 | $166 |
| 2-leg parlay | -8.9% | $8.88 | $324 |
| 3-leg parlay | -13.0% | $13.03 | $475 |
| 4-leg parlay | -17.0% | $16.98 | $620 |
| 5-leg parlay | -20.8% | $20.75 | $757 |
| 6-leg parlay | -24.4% | $24.36 | $889 |
3. The Simulation: 10,000 Bettors, 1,000 Bets Each
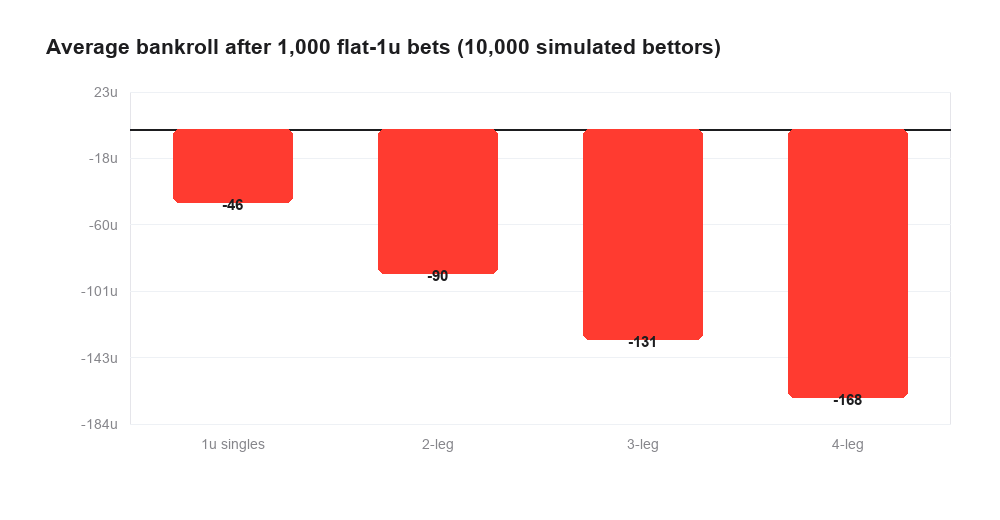
We simulated 10,000 bettors, each flat-staking 1 unit 1,000 times — one group in singles, others in 2-, 3-, and 4-leg parlays at the same -110 legs. Everyone has the same true skill (50/50 per leg). Only the bundling changes:
| Staking style | Worst 10% | Median | Best 10% | Average |
|---|---|---|---|---|
| 1u × 1 single | -84u | -46u | -7u | -46u |
| 1u × 2-leg parlay | -151u | -92u | -27u | -90u |
| 1u × 3-leg parlay | -228u | -130u | -40u | -131u |
| 1u × 4-leg parlay | -296u | -163u | -44u | -168u |
The trap: parlays are seductive because a 4-leg win "pays 12x". But the payout is the tax — 12x on a 1-in-16 shot is exactly fair odds before vig. After vig it is a -17% bet. Every hit feels like genius; every hundred bets quietly transfer ~$17 per $100 staked to the book.
4. What To Do Instead
- Bet the sides and totals that the data actually rewards — spreads are the only major bet type up meaningfully in our dataset.
- Flat-stake singles. The simulation shows the average -45u over 1,000 singles; the same legs in 4-leg bundles cost -170u. Same picks, quadruple the tax.
- If you must parlay, keep it to 2 legs — and know that even that roughly doubles your vig.
We track every bet type independently on every capper profile. Before you follow anyone, check what they're betting — a capper who ships parlays is carrying a structural handicap the leaderboard hides.
We track every bet type independently on each profile — see which cappers win on sides and which ones ship lottery tickets on the capper leaderboard.