A capper posts 8-2. You want to tail. But here is the uncomfortable truth: 8 picks cannot prove anything. We simulated 200,000 bettors to find out exactly how many picks it takes before a record stops being luck — and then audited our own grades against that standard.
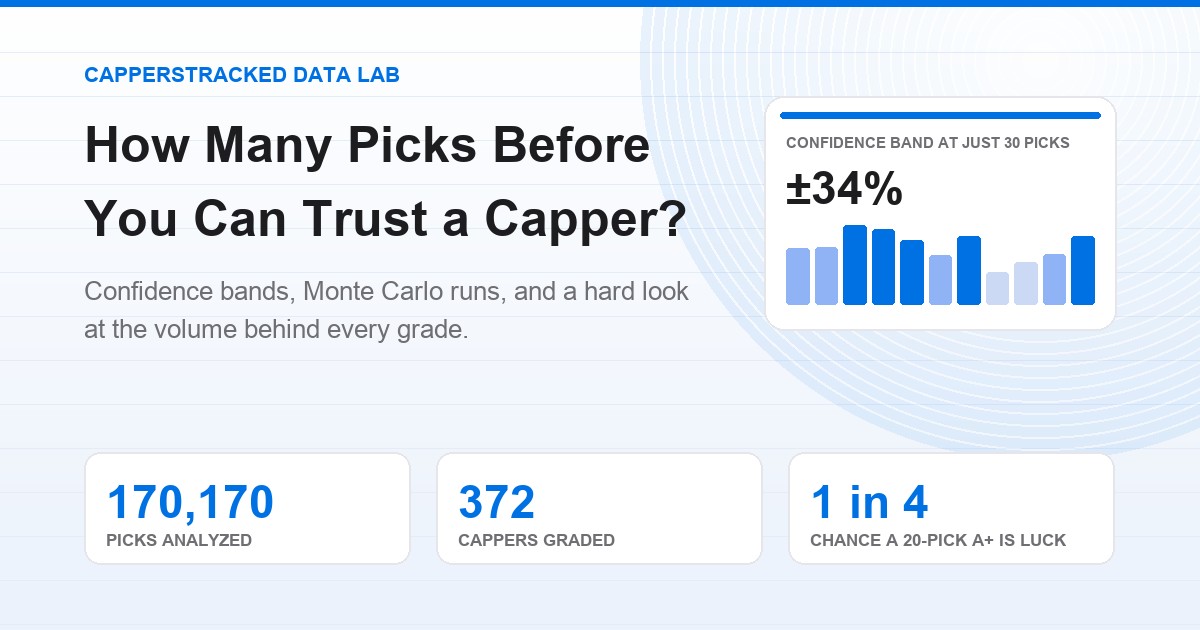
The data: every figure below is computed from the CappersTracked dataset — 1,460 tracked handicappers, 170,170 graded picks, 372 currently graded (protected variant). Snapshot: 2026-07-29. Simulations are Monte Carlo runs with a fixed seed — every chart in this series is reproducible.
1. The Coin Test
Start with the worst-case assumption: the capper is just flipping a coin against a standard -110 line. A fair coin at -110 loses 4.5% of everything it stakes — that is the vig. So the honest question is not "did they win?", it's "how many picks do they need to prove they are doing better than a coin?"
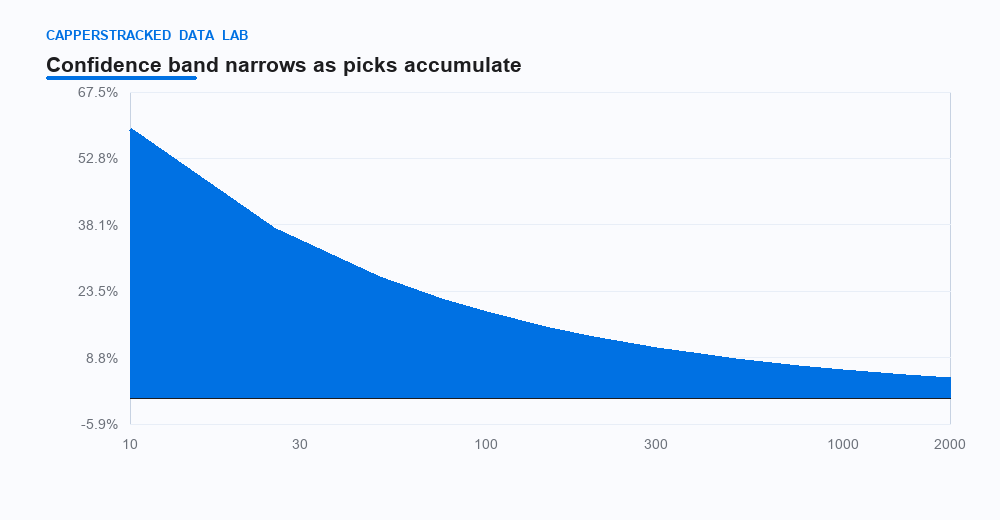
Statisticians answer with a confidence interval. With n picks, the band around the observed ROI shrinks at the rate 1/√n:
The more picks you have, the narrower the band — and once the band stops touching 0%, the edge is statistically real. Here is how fast the band closes on a fair-coin bettor:
Even at 1,000 picks the best a coin can do is pin its true edge to within ±5.9% — which is why "edge detected" at 100 picks is almost always a regression to the mean, not a discovery.
2. How Many Picks "Proves" an Edge?
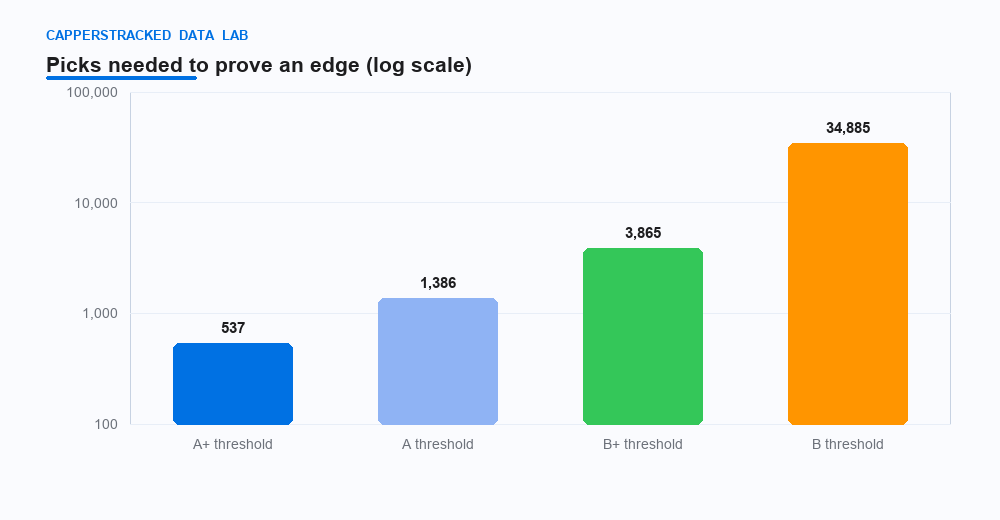
We computed the pick count where the confidence band finally separates from 0% for four edges — the raw-ROI thresholds behind our A+, A, B+ and B grades:
| Edge being proven | Picks needed (95% confidence) | At 3 picks/day |
|---|---|---|
| A+ threshold(raw ROI 8%) | 537 picks | 0.5 years |
| A threshold(raw ROI 5%) | 1,386 picks | 1.3 years |
| B+ threshold(raw ROI 3%) | 3,865 picks | 3.5 years |
| B threshold(raw ROI 1%) | 34,885 picks | ~32 years |
We verified the 5% number with a Monte Carlo run: 1,386 random bettors with a true 5% edge, 1,386 picks each — 97.3% landed profitable with a confidence band that excludes zero, right where the math says it should.
Now flip the question: how often can a coin fake an A+? At -110, posting a +8% ROI means winning about 57% of your bets. A fair coin needs that exact record just to look like the capper you are about to tail:
| Picks | Record needed for a +8% ROI | A fair coin posts it… |
|---|---|---|
| 10 | 6 of 10 | ~1 in 3 |
| 20 | 12 of 20 | ~1 in 4 |
| 50 | 29 of 50 | ~1 in 6 |
| 100 | 57 of 100 | ~1 in 10 |
| 200 | 114 of 200 | ~1 in 36 |
| 300 | 170 of 300 | ~1 in 83 |
3. What Our Own Grades Sit On
Now the uncomfortable part — our own data. Here is the distribution of graded cappers by pick count, and the median pick count behind each grade:
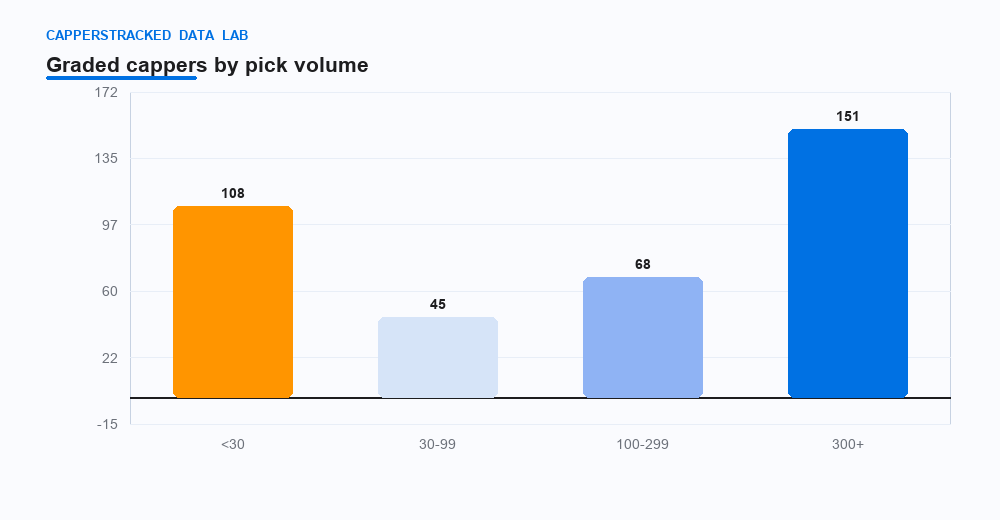
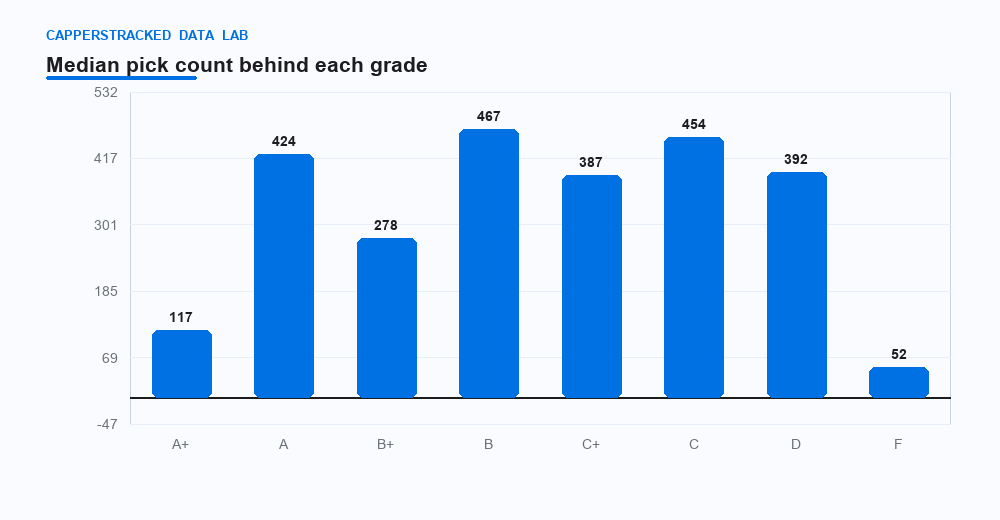
The honest read: only 5 of 23 A+ cappers have 300+ picks — the volume where an edge even starts to separate from coin-flipping. Most grades are estimates, not proof. That is exactly why we built Bayesian shrinkage (see the grading methodology): it tells you a capper's most likely skill, and it stays humble when the sample is thin.
4. So When Can You Trust a Capper?
- Under 30 picks: A grade is a courtesy. Anyone can flip 8-2. Treat an A here as "promising", not "proven".
- 30–100 picks: The shrinkage estimate is meaningful, but the confidence band is still ±20%+. Variance can flip a grade in a week.
- 100–300 picks: Trends start to separate from noise. This is where a grade begins to mean something.
- 300+ picks: A sustained edge here is statistically defensible — and rare. Only 5 of our 372 graded cappers hold an A+ at this volume.
The takeaway is not "ignore small-sample cappers" — it's know what each record can and cannot prove. Volume is the only honest currency in this game. A coin starts 8-2 about 6% of the time; a 56% winner over 800 picks is statistically real — and almost nothing in between can be told apart. Our grades already blend in sample size via shrinkage; this page shows you how thin the evidence really is behind a shiny new A+.
The call is yours — every profile shows the pick count and record behind the grade, so you can judge the evidence on the capper leaderboard.